简介
可提供当前市场形势相关信息的图表类型多种多样。许多图表很久以前就出现了,比如点数图。
该图表类型早在十九世纪末即已闻名遐迩。 Charles Dow 于 1901 年 7 月 20 日为《华尔街日报》撰写的评论首次提及该图表,并称其为“书写”法。尽管 Dow 早在 1886 年就提到过“书写”法,但直到这一天,才第一次正式确定其使用。
尽管 Dow 只在评论中介绍了这一方法,但现在您却可以找到详述此法的大量书籍。我想给交易新手推荐由 Thomas J. Dorsey 编著的一本书,名为《点数图:预测和追踪市场价格的基本应用》。
说明
点数图是一组垂直列:X 列为上升价格,而 O 列则为下滑价格。它是基于价格行为而非时间标绘,这一点独一无二。因此,从图表数据中移除一个值(时间)后,我们就得到了以 45 度角标绘的趋势线。
点数图利用两个预定义值标绘:
- 格值是指添加一个 X 或一个 O 所需的价格变动量(最初,该值以每股美元数表示,但随着时间的推移,它变成了我们将在指标中使用的点)。
- 转向值是指将列从 X 变为 O (或相反变更)所需的、以“格值”表示的价格反转量(比如说,转向值为 3,10 点的格值则对应 30 点)。
所以,我们选择一个起始点,价格上涨则放上一个 X、下跌则放 O,前提是价格变化值与“格值”和“转向值”之积相等。而且,如果价格按格值变化继续的同一方向移动,那么如是上涨,我们在 X 列的顶部加上一个 X;如是下跌,则在 O 列的底部加上一个 O。如果价格以格值和转向值的积而向相反方向移动,那么如价格上涨,我们放一个 X;如下跌,则放一个 O。由此分别启用一个新的 X 列或 O 列。
出于方便考虑,点数图通常在方格纸上标绘。为能更好地理解,我们来看一个点数图的小例子。假设我们有下述数据:
| 日期 | 最高价 | 最低价 |
|---|---|---|
| 07.03.2013 12:00 – 07.03.2013 20:00 | 1.3117 | 1.2989 |
| 07.03.2013 20:00 – 08.03.2013 04:00 | 1.3118 | 1.3093 |
| 08.03.2013 04:00 – 08.03.2013 12:00 | 1.3101 | 1.3080 |
| 08.03.2013 12:00 – 08.03.2013 20:00 | 1.3134 | 1.2955 |
假设格值等于 10,转向值为 3,我们来绘制点数图:
- 首先,我们看到价格有 128 点的增长-从 1.2989 到 1.3117,所以我们绘制 12 个 X。
- 价格随后从 1.3118 到 1.3093 跌落了 25 点,不足以转向,所以我们保持不变。
- 接下来,我们可以看到,价格继续降至 1.3080。考虑到之前的值是 1.3118,它现已变动了 38 点,所以我们可以通过添加两个 O 来启用一个新列(尽管价格变动超出了三个格值的值,我们却只放两个 O,因为 O 的下一列始终以小一个格值开始)。
- 之后,价格从 1.3080 到 1.3134 上涨了 54 点,随后又掉落了 179 点,到 1.2955。由此,下一列将包含 4 个 X,之后则是一个由 16 个 O 构成的 O 列。
如下所示:
与点数图(右)")
图 1. 日本烛形图(左)与点数图(右)
上面的点数图示例是个非常粗略的示例,只是用于辅助初学者更好地理解这一概念。
制图原则
点数制图的技巧有好几个,上文就讲过一个。而这些制图技巧又根据其所使用的数据而有所区别。比如说,我们可以使用每日数据且不考虑当日波动,即可得到一个粗略的标绘。或者,我们也可以考虑当日价格波动数据,从而得到一个更加详尽且平滑的标绘。
为实现更平滑、更准确的点数图,人们决定采用分钟数据来计算和制图,因为一分钟内的价格波动不会太大,通常不超过 6 个点,两三个点也不少见。因此,我们将使用每个分钟柱上的开盘价数据。
制表原则本身相当简单:
- 我们取一个起始点,即第一个分钟柱的开盘价。
- 而且,如果价格移动的距离大于等于格值与转向值之积,我们则分别绘制交易品种(下行为 O,上行为 X)。存储最后一个交易品种的价格数据,以供进一步的制图。
- 如果价格按格值向同一方向移动,则会绘制对应的一个交易品种。
- 而且,如果价格转向,计算将基于最后一个交易品种的价格,而不是两者中的最高价格。换句话说,如果价格波动未超过格值的 50%,它只是被忽略了。
现在,我们来确定点数图的风格。MQL5 语言支持 7 种指标绘图风格:线条、剖面(段)、直方、箭头(交易品种)、填充区域(填充通道)、柱以及日本烛形。
箭头(交易品种)对于理想的视觉呈现来讲堪称完美,但这种风格要求不同数量(MQL5 根本不支持)或大量的指标缓冲区,因为列中每一个 X 或 O 的绘制,都需要一个单独的指标缓冲区。这就意味着,如果您决定使用这种风格,就要定义波幅并具备足够的内存资源。
所以,我们决定将日本烛形作为绘图风格-即彩色的日本烛形图。不同的颜色应该用于 X 列与 O 列的区分。由此,指标仅需要 5 个缓冲区,从而实现可用资源的高效利用。
利用水平线将各列划分成为格值。得到的结果相当不错:

图 2. 利用 EURUSD 指标在日时间框架上制图
指标的算法
首先,我们需要确定指标的输入参数。由于点数图并不考虑时间,而且我们使用源于分钟柱的数据进行标绘,所以我们需要确定待处理的数据量,以免不必要地占用系统资源。此外,标绘一个使用全部历史的点数图也没有什么意义。那么,我们引入第一个参数 – History。它会将分钟柱的数量纳入计算考虑范畴。
而且,我们需要确定“格值”和“转向值”。为此,我们将分别引入 Cell 和 CellForChange 变量。我们还会为 X 引入颜色参数 ColorUp,为 O 引入 ColorDown。而最后将是线颜色参数 – LineColor。
// +++ Program start +++
//+------------------------------------------------------------------+
//|                                                         APFD.mq5 |
//|                                            Aktiniy ICQ:695710750 |
//|                                                    ICQ:695710750 |
//+------------------------------------------------------------------+
#property copyright "Aktiniy ICQ:695710750"
#property link      "ICQ:695710750"
#property version   "1.00"
//--- Indicator plotting in a separate window
#property indicator_separate_window
#property indicator_buffers 5
#property indicator_plots   1
//--- plot Label1
#property indicator_label1  "APFD"
#property indicator_type1   DRAW_COLOR_CANDLES
#property indicator_style1  STYLE_SOLID
#property indicator_color1  clrRed,clrGold
#property indicator_width1  1
//--- Set the input parameters
input int   History=10000;
input int   Cell=5;
input int   CellForChange=3;
input color ColorUp=clrRed;
input color ColorDown=clrGold;
input color LineColor=clrAqua;
//--- Declare indicator buffers
double CandlesBufferOpen[];
double CandlesBufferHigh[];
double CandlesBufferLow[];
double CandlesBufferClose[];
double CandlesBufferColor[];
//--- Array for copying calculation data from the minute bars
double OpenPrice[];
// Variables for calculations
double PriceNow=0;
double PriceBefore=0;
//--- Introduce auxiliary variables
char   Trend=0;      // Direction of the price trend
double BeginPrice=0; // Starting price for the calculation
char   FirstTrend=0; // Direction of the initial market trend
int    Columns=0;    // Variable for the calculation of columns
double InterimOpenPrice=0;
double InterimClosePrice=0;
double NumberCell=0; // Variable for the calculation of cells
double Tick=0;       // Tick size
double OldPrice=0;   // Value of the last calculation price
//--- Create arrays to temporary store data on column opening and closing prices
double InterimOpen[];
double InterimClose[];
// +++ Program start +++
我们现在来研究 OnInit() 函数。它会将指标缓冲区绑定到一维数组。我们还将设置没有为更精确显示而渲染的指标值,并
计算用于计算的辅助变量 Tick (一次价格变动的大小)的值。此外,我们还会设定颜色方案,并在指标缓冲区按时间序列设置索引顺序。要便利地计算该指标的值,该步骤必不可少。
// +++ The OnInit function +++
//+------------------------------------------------------------------+
//| Custom indicator initialization function                         |
//+------------------------------------------------------------------+
int OnInit()
  {
//--- indicator buffers mapping
   SetIndexBuffer(0,CandlesBufferOpen,INDICATOR_DATA);
   SetIndexBuffer(1,CandlesBufferHigh,INDICATOR_DATA);
   SetIndexBuffer(2,CandlesBufferLow,INDICATOR_DATA);
   SetIndexBuffer(3,CandlesBufferClose,INDICATOR_DATA);
   SetIndexBuffer(4,CandlesBufferColor,INDICATOR_COLOR_INDEX);
//--- Set the value of the indicator without rendering
   PlotIndexSetDouble(0,PLOT_EMPTY_VALUE,0);
//--- Calculate the size of one tick
   Tick=SymbolInfoDouble(Symbol(),SYMBOL_TRADE_TICK_SIZE);
//--- Set the color scheme
   PlotIndexSetInteger(0,PLOT_LINE_COLOR,0,ColorUp);
   PlotIndexSetInteger(0,PLOT_LINE_COLOR,1,ColorDown);
//--- Set the indexing order in arrays as time series
   ArraySetAsSeries(CandlesBufferClose,true);
   ArraySetAsSeries(CandlesBufferColor,true);
   ArraySetAsSeries(CandlesBufferHigh,true);
   ArraySetAsSeries(CandlesBufferLow,true);
   ArraySetAsSeries(CandlesBufferOpen,true);
//--- Check the input parameter for correctness
   if(CellForChange<2)
      Alert("The CellForChange parameter must be more than 1 due to plotting peculiarities");
//---
   return(0);
  }
// +++ The OnInit function +++
我们已经抵达指标的“核心”,执行计算所在的 OnCalculate() 函数。指标值的计算,被分解成了可从 OnCalculate() 调用的 6 个基本函数。我们来见识一下:
1. 复制数据的函数
此函数会将数据从分钟柱复制到某个计算数组。首先,我们调整接收数组的大小,再利用 CopyOpen() 函数将开盘价复制到其中。
//+------------------------------------------------------------------+
//| Function for copying data for the calculation                    |
//+------------------------------------------------------------------+
int FuncCopy(int HistoryInt)
  {
//--- Resize the array for copying calculation data
   ArrayResize(OpenPrice,(HistoryInt));
//--- Copy data from the minute bars to the array
   int Open=CopyOpen(Symbol(),PERIOD_M1,0,(HistoryInt),OpenPrice);
//---
   return(Open);
  }
2. 计算列数的函数
此函数会计算点数图的列数。
计算是在通过对上述函数中复制的分钟时间框架上柱数的循环迭代完成的。此循环本身由针对不同趋势类型的三大功能块组成:
- 0 – 不确定趋势
- 1 – 上升趋势
- -1 – 下降趋势
不确定趋势仅用一次,那就是确定初始价格变动。如果当前市场及初始价格的差值的绝对值超过了格值与转向值之积,那么就要确定价格变动的方向。
如出现下降突破,则初始趋势会被确定为一个下降趋势,且对应项就会进入 Trend 变量。上升趋势的确定方法则完全相反。此外,列数变量 ColumnsInt 的值增加。
确定当前趋势后,我们为每个方向设定两个条件。如果价格继续按格值向当前趋势方向移动,则 ColumnsInt 变量值会保持不变。如果价格按格值与转向值之积转向,则会出现一个新列,且 ColumnsInt 变量值加 1。
以此类推,直到所有列都被确定。
为了给循环中的单元格数量取整,我们将使用 MathRound() 函数,该函数允许我们将结果值舍入为最近的整数。此函数可选择根据标绘要求,用 MathFloor() 函数(向下取最近的整数)或 MathCeil() 函数(向上取最近的整数)替代。
//+------------------------------------------------------------------+
//| Function for calculating the number of columns                   |
//+------------------------------------------------------------------+
int FuncCalculate(int HistoryInt)
  {
   int ColumnsInt=0;

//--- Zero out auxiliary variables
   Trend=0;                 // Direction of the price trend
   BeginPrice=OpenPrice[0]; // Starting price for the calculation
   FirstTrend=0;            // Direction of the initial market trend
   Columns=0;               // Variable for the calculation of columns
   InterimOpenPrice=0;
   InterimClosePrice=0;
   NumberCell=0;            // Variable for the calculation of cells
//--- Loop for the calculation of the number of main buffers (column opening and closing prices)
   for(int x=0; x<HistoryInt; x++)
     {
      if(Trend==0 && (Cell*CellForChange)<fabs((BeginPrice-OpenPrice[x])/Tick))
        {
         //--- Downtrend
         if(((BeginPrice-OpenPrice[x])/Tick)>0)
           {
            NumberCell=fabs((BeginPrice-OpenPrice[x])/Tick)/Cell;
            NumberCell=MathRound(NumberCell);
            InterimOpenPrice=BeginPrice;
            InterimClosePrice=BeginPrice-(NumberCell*Cell*Tick);
            InterimClosePrice=NormalizeDouble(InterimClosePrice,Digits());
            Trend=-1;
           }
         //--- Uptrend
         if(((BeginPrice-OpenPrice[x])/Tick)<0)
           {
            NumberCell=fabs((BeginPrice-OpenPrice[x])/Tick)/Cell;
            NumberCell=MathRound(NumberCell);
            InterimOpenPrice=BeginPrice;
            InterimClosePrice=BeginPrice+(NumberCell*Cell*Tick);
            InterimClosePrice=NormalizeDouble(InterimClosePrice,Digits());
            Trend=1;
           }
         BeginPrice=InterimClosePrice;
         ColumnsInt++;
         FirstTrend=Trend;
        }
      //--- Determine further actions in case of the downtrend
      if(Trend==-1)
        {
         if(((BeginPrice-OpenPrice[x])/Tick)>0 && (Cell)<fabs((BeginPrice-OpenPrice[x])/Tick))
           {
            NumberCell=fabs((BeginPrice-OpenPrice[x])/Tick)/Cell;
            NumberCell=MathRound(NumberCell);
            InterimClosePrice=BeginPrice-(NumberCell*Cell*Tick);
            InterimClosePrice=NormalizeDouble(InterimClosePrice,Digits());
            Trend=-1;
            BeginPrice=InterimClosePrice;
           }
         if(((BeginPrice-OpenPrice[x])/Tick)<0 && (Cell*CellForChange)<fabs((BeginPrice-OpenPrice[x])/Tick))
           {
            ColumnsInt++;
            NumberCell=fabs((BeginPrice-OpenPrice[x])/Tick)/Cell;
            NumberCell=MathRound(NumberCell);
            InterimOpenPrice=BeginPrice+(Cell*Tick);
            InterimClosePrice=BeginPrice+(NumberCell*Cell*Tick);
            InterimClosePrice=NormalizeDouble(InterimClosePrice,Digits());
            Trend=1;
            BeginPrice=InterimClosePrice;
           }
        }
      //--- Determine further actions in case of the uptrend
      if(Trend==1)
        {
         if(((BeginPrice-OpenPrice[x])/Tick)>0 && (Cell*CellForChange)<fabs((BeginPrice-OpenPrice[x])/Tick))
           {
            ColumnsInt++;
            NumberCell=fabs((BeginPrice-OpenPrice[x])/Tick)/Cell;
            NumberCell=MathRound(NumberCell);
            InterimOpenPrice=BeginPrice-(Cell*Tick);
            InterimClosePrice=BeginPrice-(NumberCell*Cell*Tick);
            InterimClosePrice=NormalizeDouble(InterimClosePrice,Digits());
            Trend=-1;
            BeginPrice=InterimClosePrice;
           }
         if(((BeginPrice-OpenPrice[x])/Tick)<0 && (Cell)<fabs((BeginPrice-OpenPrice[x])/Tick))
           {
            NumberCell=fabs((BeginPrice-OpenPrice[x])/Tick)/Cell;
            NumberCell=MathRound(NumberCell);
            InterimClosePrice=BeginPrice+(NumberCell*Cell*Tick);
            InterimClosePrice=NormalizeDouble(InterimClosePrice,Digits());
            Trend=1;
            BeginPrice=InterimClosePrice;
           }
        }
     }
//---
   return(ColumnsInt);
  }
3. 列着色函数
此函数旨在利用预设的颜色方案,根据需要为各列着色。为此,我们将编写一个就列数迭代的循环,并为奇偶数列设定相应颜色,且考虑到初始趋势值(初始列)。
//+------------------------------------------------------------------+
//| Function for coloring columns                                    |
//+------------------------------------------------------------------+
int FuncColor(int ColumnsInt)
  {
   int x;
//--- Fill the buffer of colors for drawing
   for(x=0; x<ColumnsInt; x++)
     {
      if(FirstTrend==-1)
        {
         if(x%2==0) CandlesBufferColor[x]=1; // All even buffers of color 1
         if(x%2>0) CandlesBufferColor[x]=0;  // All odd buffers of color 0
        }
      if(FirstTrend==1)
        {
         if(x%2==0) CandlesBufferColor[x]=0; // All odd buffers of color 0
         if(x%2>0) CandlesBufferColor[x]=1;  // All even buffers of color 1
        }
     }
//---
   return(x);
  }
4. 确定列尺寸的函数
确定待用列数并设定必要的颜色后,我们需要确定列的高度。为此,我们将创建临时数组 InterimOpen[] 和 InterimClose[],每个列的开盘与收盘价也都将存储于此。上述数组的大小将与柱数相等。
之后,我们将拥有一个几乎与 FuncCalculate() 函数循环完全一致的循环,而其区别在于,除了上述所有内容之外,它还会存储每列的开盘与收盘价。而这种划分方式,其目的即在于提前知道图表中的列数。理论上讲,我们可以最初故意为数组内存分配设置一个更大的列数,但只使用一个循环。但这种情况下,我们又会更大量地占用内存资源。
现在,我们更仔细地研究一下列高度的确定。价格移动的距离与所需格值数相等后,我们就计算其数量,并取最近的整数。之后,我们将当前列的格值总数添加到列开盘价,由此获取亦变成最后使用价格的列收盘价。后续所有的步骤都会用到它。
//+------------------------------------------------------------------+
//| Function for determining the column size                         |
//+------------------------------------------------------------------+
int FuncDraw(int HistoryInt)
  {
//--- Determine the sizes of temporary arrays
   ArrayResize(InterimOpen,Columns);
   ArrayResize(InterimClose,Columns);
//--- Zero out auxiliary variables
   Trend=0;                 // Direction of the price trend
   BeginPrice=OpenPrice[0]; // Starting price for the calculation
   NumberCell=0;            // Variable for the calculation of cells
   int z=0;                 // Variable for indices of temporary arrays
//--- Loop for filling the main buffers (column opening and closing prices)
   for(int x=0; x<HistoryInt; x++)
     {
      if(Trend==0 && (Cell*CellForChange)<fabs((BeginPrice-OpenPrice[x])/Tick))
        {
         //--- Downtrend
         if(((BeginPrice-OpenPrice[x])/Tick)>0)
           {
            NumberCell=fabs((BeginPrice-OpenPrice[x])/Tick)/Cell;
            NumberCell=MathRound(NumberCell);
            InterimOpen[z]=BeginPrice;
            InterimClose[z]=BeginPrice-(NumberCell*Cell*Tick);
            InterimClose[z]=NormalizeDouble(InterimClose[z],Digits());
            Trend=-1;
           }
         //--- Uptrend
         if(((BeginPrice-OpenPrice[x])/Tick)<0)
           {
            NumberCell=fabs((BeginPrice-OpenPrice[x])/Tick)/Cell;
            NumberCell=MathRound(NumberCell);
            InterimOpen[z]=BeginPrice;
            InterimClose[z]=BeginPrice+(NumberCell*Cell*Tick);
            InterimClose[z]=NormalizeDouble(InterimClose[z],Digits()); // Normalize the number of decimal places
            Trend=1;
           }
         BeginPrice=InterimClose[z];
        }
      //--- Determine further actions in case of the downtrend
      if(Trend==-1)
        {
         if(((BeginPrice-OpenPrice[x])/Tick)>0 && (Cell)<fabs((BeginPrice-OpenPrice[x])/Tick))
           {
            NumberCell=fabs((BeginPrice-OpenPrice[x])/Tick)/Cell;
            NumberCell=MathRound(NumberCell);
            InterimClose[z]=BeginPrice-(NumberCell*Cell*Tick);
            InterimClose[z]=NormalizeDouble(InterimClose[z],Digits());
            Trend=-1;
            BeginPrice=InterimClose[z];
           }
         if(((BeginPrice-OpenPrice[x])/Tick)<0 && (Cell*CellForChange)<fabs((BeginPrice-OpenPrice[x])/Tick))
           {
            z++;
            NumberCell=fabs((BeginPrice-OpenPrice[x])/Tick)/Cell;
            NumberCell=MathRound(NumberCell);
            InterimOpen[z]=BeginPrice+(Cell*Tick);
            InterimClose[z]=BeginPrice+(NumberCell*Cell*Tick);
            InterimClose[z]=NormalizeDouble(InterimClose[z],Digits());
            Trend=1;
            BeginPrice=InterimClose[z];
           }
        }
      //--- Determine further actions in case of the uptrend
      if(Trend==1)
        {
         if(((BeginPrice-OpenPrice[x])/Tick)>0 && (Cell*CellForChange)<fabs((BeginPrice-OpenPrice[x])/Tick))
           {
            z++;
            NumberCell=fabs((BeginPrice-OpenPrice[x])/Tick)/Cell;
            NumberCell=MathRound(NumberCell);
            InterimOpen[z]=BeginPrice-(Cell*Tick);
            InterimClose[z]=BeginPrice-(NumberCell*Cell*Tick);
            InterimClose[z]=NormalizeDouble(InterimClose[z],Digits());
            Trend=-1;
            BeginPrice=InterimClose[z];
           }
         if(((BeginPrice-OpenPrice[x])/Tick)<0 && (Cell)<fabs((BeginPrice-OpenPrice[x])/Tick))
           {
            NumberCell=fabs((BeginPrice-OpenPrice[x])/Tick)/Cell;
            NumberCell=MathRound(NumberCell);
            InterimClose[z]=BeginPrice+(NumberCell*Cell*Tick);
            InterimClose[z]=NormalizeDouble(InterimClose[z],Digits());
            Trend=1;
            BeginPrice=InterimClose[z];
           }
        }
     }
//---
   return(z);
  }
5. 数组转向的函数
此函数会转向所获的列数组数据,从而进一步以编程方式从右到左显示图表。数组转向在一个循环中执行,烛形赋予最高、最低值。这样做是因为该指标仅显示那些所有指标缓冲区值都不为零的烛形。
//+------------------------------------------------------------------+
//| Function for array reversal                                      |
//+------------------------------------------------------------------+
int FuncTurnArray(int ColumnsInt)
  {
//--- Variable for array reversal
   int d=ColumnsInt;
   for(int x=0; x<ColumnsInt; x++)
     {
      d--;
      CandlesBufferOpen[x]=InterimOpen[d];
      CandlesBufferClose[x]=InterimClose[d];
      if(CandlesBufferClose[x]>CandlesBufferOpen[x])
        {
         CandlesBufferHigh[x]=CandlesBufferClose[x];
         CandlesBufferLow[x]=CandlesBufferOpen[x];
        }
      if(CandlesBufferOpen[x]>CandlesBufferClose[x])
        {
         CandlesBufferHigh[x]=CandlesBufferOpen[x];
         CandlesBufferLow[x]=CandlesBufferClose[x];
        }
     }
//---
   return(d);
  }
6. 绘制水平线的函数
此函数会利用水平线(对象)绘成一个多“格”的网格。在函数的开头,我们确定源于计算数据数组的最大与最小价格值。之后,这些值会用于从起始点逐步标绘上下线条。
//+------------------------------------------------------------------+
//| Function for drawing horizontal lines                            |
//+------------------------------------------------------------------+
int FuncDrawHorizontal(bool Draw)
  {
   int Horizontal=0;
   if(Draw==true)
     {
      //--- Create horizontal lines (lines for separation of columns)
      ObjectsDeleteAll(0,ChartWindowFind(),OBJ_HLINE); // Delete all old horizontal lines
      int MaxPriceElement=ArrayMaximum(OpenPrice);     // Determine the maximum price level
      int MinPriceElement=ArrayMinimum(OpenPrice);     // Determine the minimum price level
      for(double x=OpenPrice[0]; x<=OpenPrice[MaxPriceElement]+(Cell*Tick); x=x+(Cell*Tick))
        {
         ObjectCreate(0,DoubleToString(x,Digits()),OBJ_HLINE,ChartWindowFind(),0,NormalizeDouble(x,Digits()));
         ObjectSetInteger(0,DoubleToString(x,Digits()),OBJPROP_COLOR,LineColor);
         ObjectSetInteger(0,DoubleToString(x,Digits()),OBJPROP_STYLE,STYLE_DOT);
         ObjectSetInteger(0,DoubleToString(x,Digits()),OBJPROP_SELECTED,false);
         ObjectSetInteger(0,DoubleToString(x,Digits()),OBJPROP_WIDTH,1);
         Horizontal++;
        }
      for(double x=OpenPrice[0]-(Cell*Tick); x>=OpenPrice[MinPriceElement]; x=x-(Cell*Tick))
        {
         ObjectCreate(0,DoubleToString(x,Digits()),OBJ_HLINE,ChartWindowFind(),0,NormalizeDouble(x,Digits()));
         ObjectSetInteger(0,DoubleToString(x,Digits()),OBJPROP_COLOR,LineColor);
         ObjectSetInteger(0,DoubleToString(x,Digits()),OBJPROP_STYLE,STYLE_DOT);
         ObjectSetInteger(0,DoubleToString(x,Digits()),OBJPROP_SELECTED,false);
         ObjectSetInteger(0,DoubleToString(x,Digits()),OBJPROP_WIDTH,1);
         Horizontal++;
        }
      ChartRedraw();
     }
//---
   return(Horizontal);
  }
我们已经讲完了所有基本函数,现在我们来看一看它们在 OnCalculate() 中的调用顺序:
- 启动复制计算数据的函数(前提是还没有已计算的柱)。
- 调用计算列数的函数。
- 确定列颜色。
- 确定列大小。
- 调用数组中数据转向的函数。
- 调用标绘可将各列划分成多“格”的水平线的函数。
// +++ Main calculations and plotting +++
//+------------------------------------------------------------------+
//| Custom indicator iteration function                              |
//+------------------------------------------------------------------+
int OnCalculate(const int rates_total,
                const int prev_calculated,
                const datetime &time[],
                const double &open[],
                const double &high[],
                const double &low[],
                const double &close[],
                const long &tick_volume[],
                const long &volume[],
                const int &spread[])
  {
//--- Reverse the array to conveniently get the last price value
   ArraySetAsSeries(close,true);
//---
   if(prev_calculated==0)
     {
      //--- Start the function for copying data for the calculation
      int ErrorCopy=FuncCopy(History);
      //--- In case of error, print the message
      if(ErrorCopy==-1)
        {
         Alert("Failed to copy. Data is still loading.");
         return(0);
        }
      //--- Call the function for calculating the number of columns
      Columns=FuncCalculate(History);
      //--- Call the function for coloring columns
      int ColorCalculate=FuncColor(Columns);
      //--- Call the function for determining column sizes
      int z=FuncDraw(History);
      //--- Start the function for array reversal
      int Turn=FuncTurnArray(Columns);
      //--- Start the function for drawing horizontal lines
      int Horizontal=FuncDrawHorizontal(true);
      //--- Store the value of the last closing price in the variable
      OldPrice=close[0];
     }
//--- If the price is one box size different from the previous one,
//--- the indicator is recalculated
   if(fabs((OldPrice-close[0])/Tick)>Cell)
      return(0);
//--- return value of prev_calculated for next call
   return(rates_total);
  }
// +++ Main calculations and plotting +++
指标核心代码到此就结束了。但是,由于该指标存在包含复杂数组方面的缺陷,所以有时需要重新加载。
为此,我们将采用 OnChartEvent() 函数(处理按下 “С” 键 – 清除,和 “R” 键 – 重绘)。为了清除,则为一个指标缓冲区赋予零值。图表重绘函数,表示之前计算以及为指标缓冲区赋值的重复。
// +++ Secondary actions for the "С" key - clear and the "R" key - redraw +++
//+------------------------------------------------------------------+
//| ChartEvent function                                              |
//+------------------------------------------------------------------+
void OnChartEvent(const int id,
                  const long &lparam,
                  const double &dparam,
                  const string &sparam)
  {
//---
   if(id==CHARTEVENT_KEYDOWN)
     {
      //--- 67 - The "C" key code clears the indicator buffer
      if(lparam==67)
        {
         for(int x=0; x<Bars(Symbol(),PERIOD_CURRENT); x++)
            CandlesBufferOpen[x]=0;
         ChartRedraw();
        }
      // 82 - The "R" key code redraws the indicator
      if(lparam==82)
        {
         //--- Start the copying function
         int ErrorCopy=FuncCopy(History);
         //--- In case of error, print the message
         if(ErrorCopy==-1)
            Alert("Failed to copy data.");
         //--- Call the function for calculating the number of columns
         Columns=FuncCalculate(History);
         //--- Call the function for coloring columns
         int ColorCalculate=FuncColor(Columns);
         //--- Call the function for determining column sizes
         int z=FuncDraw(History);
         //--- Start the function for array reversal
         int Turn=FuncTurnArray(Columns);
         //--- Start the function for drawing horizontal lines
         int Horizontal=FuncDrawHorizontal(true);
        }
     }
  }
//+------------------------------------------------------------------+
// +++ Secondary actions for the "С" key - clear and the "R" key - redraw +++
现在我们可以长出一口气了,因为我们已经完成了算法与指标代码的讲述,可以继续研究一些生成交易执行信号的点数图形态了。
标准信号
有两种交易和点数图分析的方法:一种基于形态,另一种基于支撑和阻力线。而后者的特点在于,支撑和阻力线都是以 45 度角标绘(在设计好的指标中未必总是如此,因为它是利用日本烛形标绘,而日本烛形的尺寸则根据主图表的尺寸变化,可能导致角度变形)。
现在,我们照此来研究一下形态:
-
“双顶” 与 “双底” 形态。
“双顶”会在价格先上涨、后下滑时出现,形成一个特定的 O 列,然后再次上涨,超过之前的 X 列一格值。此形态是一个买入信号。
“双底”正好与“双顶”形态完全相反。会有一次特定的价格下滑(一个 O 列),然后是一个 X 列、另一个较前一 O 列下滑一格的 O列,由此形成一个卖出信号。

图 3. “双顶”与“双底”形态
-
“三顶” 与 “三底” 形态。
此类形态不太常见,但却是极强信号的体现。从本质上来看,它们与“双顶”和“双底”形态类似,是其延续。在其传递信号之前,也会重复上述两种形态的动作。
如果价格两次触及同一价格位、之后突破该价位,则出现“三顶”,,这是一个买入信号。
“三底”形态与“三顶”相反,如果价格跌至同一价位两次、之后跌至该价位以下,则出现该形态,这是一个卖出信号。

图 4. “三顶”与“三底”形态
-
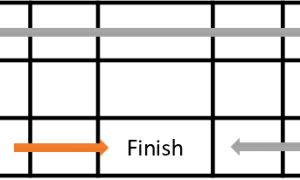
“对称三角形突破” 形态:上升和下降。
我们还都记得技术分析形态。“对称三角形突破”形态与技术分析中的“对称三角形”类似。上升突破(如下方左图所示)是一个买入信号。相反,下降突破就是一个卖出信号(右图)。

图 5. “对称三角形突破”:上升和下降
-
“牛市弹射器” 与 “熊市弹射器” 形态。
“弹射器”与技术分析的“上升三角形”和“下降三角形”形态有一定程度上的相似。这些信号本质上是一样的 – 只要价格向上或向下突破了三角形的平等边,就会分别出现买入或卖出信号。如是“牛市弹射器”,价格上升突破,它是一个买入信号(左图);如是“熊市弹射器”,价格下降突破,则是一个卖出信号(右图)。

图 6. “牛市弹射器”与“熊市弹射器”形态
-
“45 度趋势线” 形态
“45 度趋势线”形态会创建一条支撑或阻力线。如果该线有突破,则我们会得到一个卖出信号(如右图所示)或买入信号(如左图所示)。

图 7. “45 度趋势线”形态
我们已经讲解了标准的点数图形态和信号。现在,我们到本文开头处提供的指标图中看看部分指标:

图 8. 确定点数图中的形态
总结
我们已经来到了本文的最后部分。我想说的是,点数图并未消逝于历史长河,至今仍在活跃应用,这也再一次地证明了它的价值。
已经发展成熟的指标,尽管未能做到完美无暇,比如用的是方块图而不是平常的 X 和 O,而且不能在策略测试程序中执行测试(甚至错误运行)等等,但仍生成了相当准确的图表结果。
我还想提醒大家,此算法经过少许的修改,即可用于 Renko 图表,也可以将两种图表类型整合为一个带菜单选项的单一代码,以供您作出相应选择。我也没有排除在主窗口直接标绘图表的可能性,只是这样需要再次对代码做少许修改。
总而言之,本文的目的就是分享一下我对指标开发的相关想法。这是我的第一篇文章,感谢您的评论或反馈。感谢您阅读本文!
本文译自 MetaQuotes Software Corp. 撰写的俄文原文
原文地址: https://www.mql5.com/ru/articles/656
MyFxtop迈投(www.myfxtop.com)-靠谱的外汇跟单社区,免费跟随高手做交易!
免责声明:本文系转载自网络,如有侵犯,请联系我们立即删除,另:本文仅代表作者个人观点,与迈投财经无关。其原创性以及文中陈述文字和内容未经本站证实,对本文以及其中全部或者部分内容、文字的真实性、完整性、及时性本站不作任何保证或承诺,请读者仅作参考,并请自行核实相关内容。
著作权归作者所有。
商业转载请联系作者获得授权,非商业转载请注明出处。