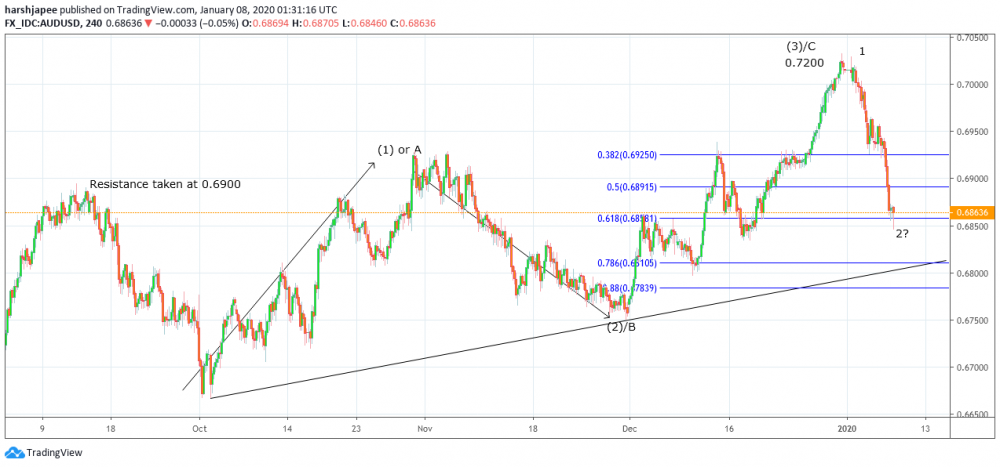
Bottom line: AUDUSD bullish structure to remain intact until prices stay above 0.6750 levels, which is Wave (2)/B termination.
Technical Analysis:
AUDUSD bulls are expected to regain control after finding support around the 0.6850 zone today. Immediate upside targets remain around 0.7200 mark, while prices stay above 0.6750, which is potential Wave (2)/B termination. Looking at the short term wave count since 0.6750 lows print on November 29, 2019; AUDUSD bulls seem to have carved Waves 1 and 2 within Wave (3) at 0.7030 and 0.6850 levels respectively. Please note that the wave counts have been adjusted according to the price action unfolding since 0.7030 highs, since last week. Also note that Wave 2 termination was around the fibonacci 0.618 retracement of Wave 1, which should be encouraging to bulls. A high probable trade direction from here is expected o the north side against 0.6750 levels, with potential targets above 0.7200 mark. Also note that a Morning Star bullish candlestick pattern is appearing on the 4H chart, around 0.6850 levels, seen as potential bullish reversal. Now looking at the overall medium term wave structure since 0.6668 lows print on October 02, 2019; AUDUSD is looking poised to print higher, until prices stay above 0.6750 levels. The initial rally between 0.6668 and 0.6929 was in 5 waves, labelled as Wave (1)/A. This was followed by a corrective drop towards 0.6750 levels, labelled as Wave (2)/B. If the above described wave counts are correct, Wave (3) is progressing at the moment, and should sub divide into 5 waves towards 0.7200 levels. Bottom line remains that 0.6750 support should hold, for the above structure to push higher. A break below 0.6750 could indicate that the corrective rally A-B-C from 0.6668 through 0.7030 is complete, and AUDUSD might print fresh lows before finding a bottom.
Prepared by
Harsh Japee, Technical Analyst.
AUDUSD Chart
MyFxtops 邁投 (www.myfxtops.com) -Reliable Forex Copy Trade community, follow the master for free to trade!
Disclaimer: This article is reproduced from the Internet. If there is any infringement, please contact us to delete it immediately. In addition: This article only represents the personal opinion of the author and has nothing to do with Mato Finance The originality and the text and content stated in this article have not been confirmed by this site. The authenticity, completeness and timeliness of this article and all or part of the content and text are not guaranteed or promised. Please refer to it for reference only Verify the content yourself.
Copyright belongs to the author.
For commercial reprints, please contact the author for authorization. For non-commercial reprints, please indicate the source.
MyFxtops迈投(www.myfxtops.com)-靠谱的外汇跟单社区,免费跟随高手做交易!
免责声明:本文系转载自网络,如有侵犯,请联系我们立即删除,另:本文仅代表作者个人观点,与迈投财经无关。其原创性以及文中陈述文字和内容未经本站证实,对本文以及其中全部或者部分内容、文字的真实性、完整性、及时性本站不作任何保证或承诺,请读者仅作参考,并请自行核实相关内容。
著作权归作者所有。
商业转载请联系作者获得授权,非商业转载请注明出处。