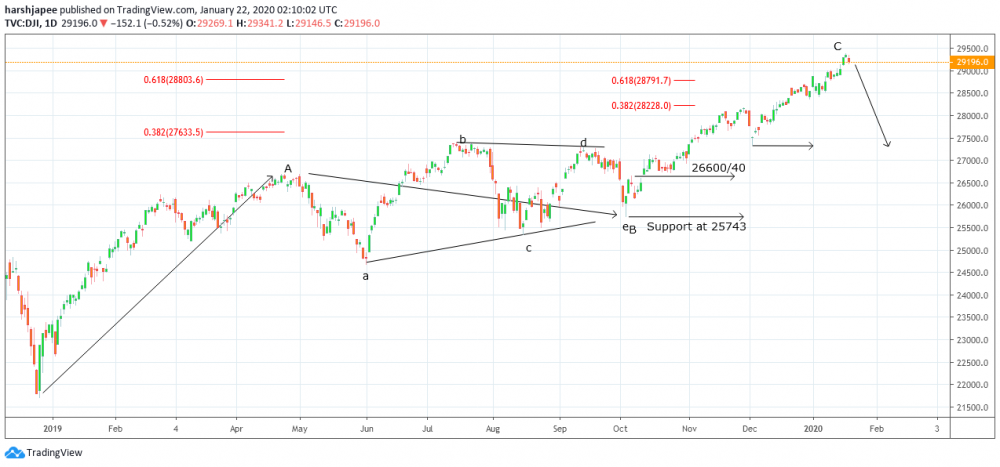
Bottom line: Dow Jones hits fresh highs at 29373 with RSI displaying bearish divergence on the daily chart. It is good to avoid getting into a bull trap, as a sharp reversal seems to be on cards.
Technical Analysis:
Dow Jones hits yet another high at 29373 before reversing, clearly showing resilience towards a bearish reversal. Structurally, the rally that began in December 2018 after printing 21792 lows has completed 3 waves labelled as A-B-C here. The above rally seems to be a part of a larger correction and prices are expected to drop towards 21700 at least. A series of new highs being print lately could be a bull trap, which is better avoided. Immediate price support is seen at 28500 levels and a break below that would finally confirm that a meaningful top is in place at 29373. Please also note that RSI on the daily chart has been diverging lower with each high (not shown here). It could be just a matter of time before the indice reverses lower. Early signs are already being confirmed with an evening star candlestick pattern, after printing highs at 29373. A follow through in price action is required to break below 28500 to confirm. An aggressive trading strategy still remains to be on the short side against 29373 with potential targets around 28000. Also note that the fibonacci 0.382 retracement of Wave C here is around the 28000 mark. If the drop is Wave 4 of the rally that began from 21792, it should find support around 28000. A conservative trading strategy could be to remain flat for now and allow prices to break below 28500, and then look to sell on rallies. In either case, avoid getting into a clear bull trap as traders look to be preparing for a meaningful reversal ahead.
Prepared by
Harsh Japee, Technical Analyst.
Dow Jones Chart
MyFxtops 邁投 (www.myfxtops.com) -Reliable Forex Copy Trade community, follow the master for free to trade!
Disclaimer: This article is reproduced from the Internet. If there is any infringement, please contact us to delete it immediately. In addition: This article only represents the personal opinion of the author and has nothing to do with Mato Finance The originality and the text and content stated in this article have not been confirmed by this site. The authenticity, completeness and timeliness of this article and all or part of the content and text are not guaranteed or promised. Please refer to it for reference only Verify the content yourself.
Copyright belongs to the author.
For commercial reprints, please contact the author for authorization. For non-commercial reprints, please indicate the source.
MyFxtops迈投(www.myfxtops.com)-靠谱的外汇跟单社区,免费跟随高手做交易!
免责声明:本文系转载自网络,如有侵犯,请联系我们立即删除,另:本文仅代表作者个人观点,与迈投财经无关。其原创性以及文中陈述文字和内容未经本站证实,对本文以及其中全部或者部分内容、文字的真实性、完整性、及时性本站不作任何保证或承诺,请读者仅作参考,并请自行核实相关内容。
著作权归作者所有。
商业转载请联系作者获得授权,非商业转载请注明出处。