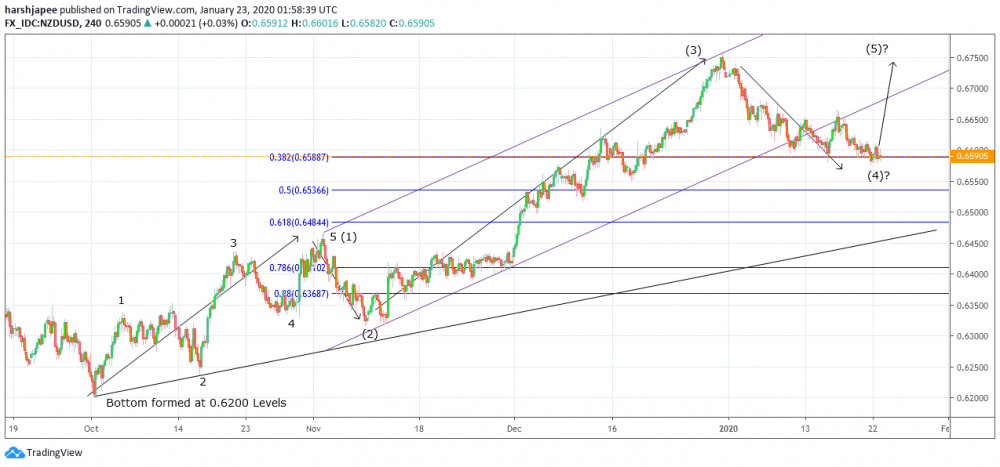
Bottom line: NZDUSD bullish structure remains intact until prices stay above 0.6450. The support trend line is also seen passing through the same levels around this time.
Technical Analysis:
NZDUSD bulls are poised to come back after having taken a short break since 0.6755 highs. Looking at the wave structure since recent swing highs, NZDUSD might have completed a corrective drop around 0.6580 levels yesterday. Prices have dropped towards the fibonacci 0.382 retracement at 0.6588 of Wave (3), a common wave relation. The Elliott Channel has been broken temporarily but is now seen to be giving way for a potential rally above 0.6667, which is immediate resistance. If the above structure holds, we should witness a rally towards 0.6930 levels with 0.6450 intact. Looking at the overall wave structure since 0.6200 lows on October 01, 2019 a potential impulse wave can be seen underway. Within the proposed impulse, Waves (1) through (4) seem to be in place at 0.6460, 0.6317, 0.6755 and 0.6578 respectively. If the above larger degree counts are correct, NZDUSD should stage a rally towards 0.6800 and 0.6930 levels as Wave (5) progresses further. Ideally prices should remain above 0.6450/60 mark, which is Wave (1) termination, for the above impulse structure to remain intact. Please also note that a major price resistance is seen through 0.6800/0.6800 levels on the daily chart. The above price targets for Wave (5) if reached, would take resistances out further strengthening the bullish structure. Alternately, a drop below 0.6450 would indicate that prices may drop towards 0.6200 or further, before turning higher again. Watch out for a bullish reversal pattern around current price (0.6590/91), and a break above 0.6667 would confirm that a meaningful bottom is in place at 0.6578. It is safe to remain long with a protective stop at 0.6450 and potential target towards 0.6930.
Prepared by
Harsh Japee, Technical Analyst.
NZDUSD Chart
MyFxtops 邁投 (www.myfxtops.com) -Reliable Forex Copy Trade community, follow the master for free to trade!
Disclaimer: This article is reproduced from the Internet. If there is any infringement, please contact us to delete it immediately. In addition: This article only represents the personal opinion of the author and has nothing to do with Mato Finance The originality and the text and content stated in this article have not been confirmed by this site. The authenticity, completeness and timeliness of this article and all or part of the content and text are not guaranteed or promised. Please refer to it for reference only Verify the content yourself.
Copyright belongs to the author.
For commercial reprints, please contact the author for authorization. For non-commercial reprints, please indicate the source.
MyFxtops迈投(www.myfxtops.com)-靠谱的外汇跟单社区,免费跟随高手做交易!
免责声明:本文系转载自网络,如有侵犯,请联系我们立即删除,另:本文仅代表作者个人观点,与迈投财经无关。其原创性以及文中陈述文字和内容未经本站证实,对本文以及其中全部或者部分内容、文字的真实性、完整性、及时性本站不作任何保证或承诺,请读者仅作参考,并请自行核实相关内容。
著作权归作者所有。
商业转载请联系作者获得授权,非商业转载请注明出处。