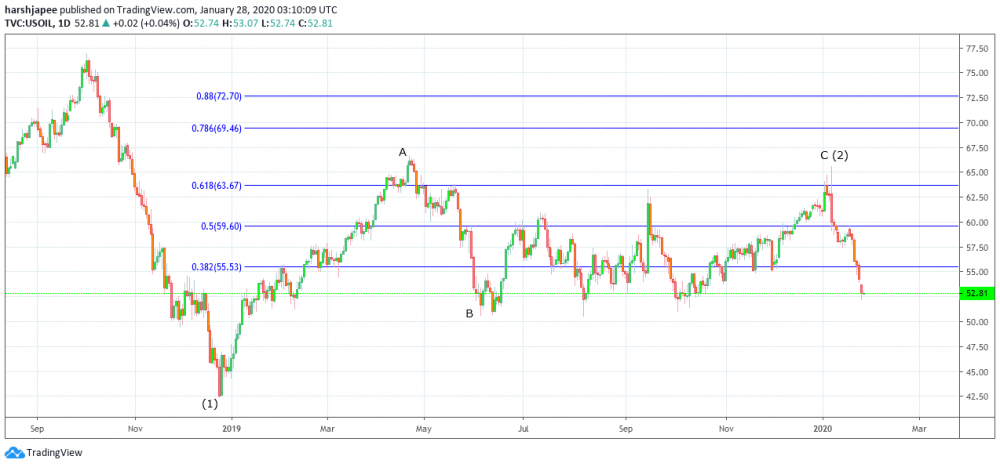
Bottom line: WTI Crude bearish structure remains intact until prices stay below 65.62 levels.
Technical Analysis:
WTI Crude remains in control of bears after having reversed sharply lower from 65.62 highs on January 08, 2020. Looking at the short term wave structure, the drop from 65.62 levels is seen to have unfolded into 3 waves. A 5 wave drop and a subsequent break below 50.50 range lows would confirm a bearish reversal and rallies are good to be sold after that. If aggressive shorts were taken from around 65.50 zones, it would be considered safe to take profits at current levels 52.86. Alternately, WTI Crude might be still unfolding into a complex correction and Wave C of (2) may print above 65.62 levels. This would complete an ending diagonal structure as Wave C would be looking to terminate above 65.62 levels before reversing. It is good to allow price action to unfold from here, before deciding further trade direction. Looking at the larger wave structure, the drop between 76.88 and 42.40 levels was an impulse, labelled as Wave (1) here. The subsequent rally has been a complex corrective structure A-B-C that terminated at 65.62 levels as a running flat, labelled as Wave (2). If the above counts are correct, WTI Crude would continue dropping further towards 50.50 levels sub dividing into 5 waves. Furthermore prices would hold below 65.62 going forward. Alternately, if Wave C is unfolding as a diagonal, prices would stay above 50.50 and push higher above 65.62 to terminate. It is a safe trading strategy to remain flat for now and wait for further price action to determine the next trade direction. A break above 56.00 would be encouraging for bulls and rally might continue to terminate above 65.62, going forward. Aggressive trade setup would be to go long now with stops at 50.00 and potential target above 65.62.
Prepared by,
Harsh Japee, Technical Analyst.
WTI Crude Chart
MyFxtops 邁投 (www.myfxtops.com) -Reliable Forex Copy Trade community, follow the master for free to trade!
Disclaimer: This article is reproduced from the Internet. If there is any infringement, please contact us to delete it immediately. In addition: This article only represents the personal opinion of the author and has nothing to do with Mato Finance The originality and the text and content stated in this article have not been confirmed by this site. The authenticity, completeness and timeliness of this article and all or part of the content and text are not guaranteed or promised. Please refer to it for reference only Verify the content yourself.
Copyright belongs to the author.
For commercial reprints, please contact the author for authorization. For non-commercial reprints, please indicate the source.
MyFxtops迈投(www.myfxtops.com)-靠谱的外汇跟单社区,免费跟随高手做交易!
免责声明:本文系转载自网络,如有侵犯,请联系我们立即删除,另:本文仅代表作者个人观点,与迈投财经无关。其原创性以及文中陈述文字和内容未经本站证实,对本文以及其中全部或者部分内容、文字的真实性、完整性、及时性本站不作任何保证或承诺,请读者仅作参考,并请自行核实相关内容。
著作权归作者所有。
商业转载请联系作者获得授权,非商业转载请注明出处。