Bottom line: FTSE bearish structure still remains intact with prices staying below 7724 levels. A pullback could be expected before the drop could resume further.
Technical Analysis:
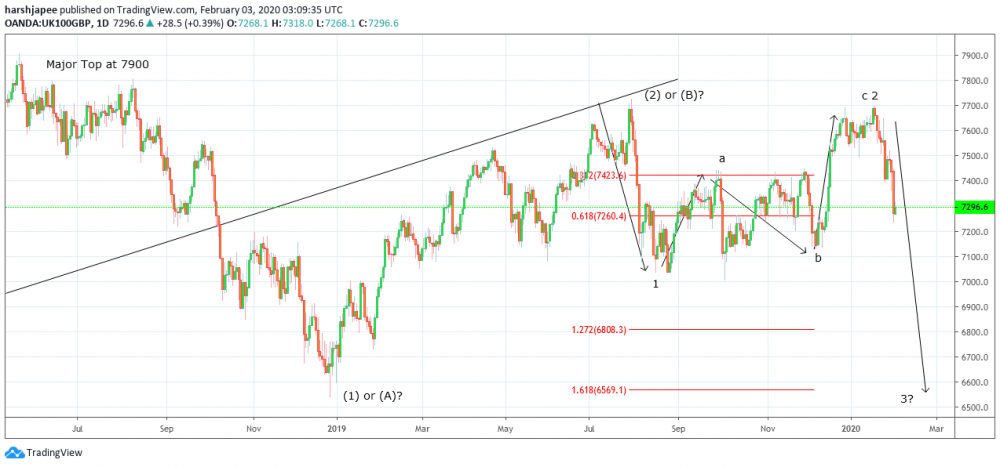
FTSE bears seem to be in control, dragging prices down by almost 450 points from close to 7700 levels as expected. FTSE has found interim support at the fibonacci 0.786 retracement of previous rally between 7138 and 7696 levels. A bullish bounce here could re-test 7700 handle before reversing lower again, while a break below 7139 would be encouraging for bears. Looking at the overall wave structure, FTSE seem to have produced a 5-3 pattern at a larger degree. The drop from 7904 highs to 6635 was in 5 waves, labelled as Wave (1). The subsequent rally was an A-B-C corrective wave that probably terminated around 7724 levels, labelled as Wave (2). Ideally, a 5-3 Elliott Wave pattern is followed by another 5 waves towards the major trend, which is down in this case. Therefore, another 5 wave drop can be expected as Wave (3), dragging prices below 6635 levels. FTSE might have already produced waves 1 and 2 at 7034 and 7696 respectively. If the above counts are correct, a 3rd of 3rd wave is underway and should push lower towards 6569 levels going forward. Alternately, possibility remains that the larger degree Wave (2) might still be incomplete at 7724. If lower degree wave C is unfolding as a diagonal, there could be yet another rally above 7696 levels before Wave (2) could finally terminate. Hence, it is recommended to take profits and exit short positions taken earlier from 7650 levels and remain flat. An aggressive trading strategy for short term could be on the long side, against 7100 and targeting above 7696; while a more safe strategy would be to remain flat and look to sell on pullback or rallies. Major trend still remains lower until 7724 is in place.
Prepared by
Harsh Japee, Technical Analyst.
FTSE Chart
MyFxtops 邁投 (www.myfxtops.com) -Reliable Forex Copy Trade community, follow the master for free to trade!
Disclaimer: This article is reproduced from the Internet. If there is any infringement, please contact us to delete it immediately. In addition: This article only represents the personal opinion of the author and has nothing to do with Mato Finance The originality and the text and content stated in this article have not been confirmed by this site. The authenticity, completeness and timeliness of this article and all or part of the content and text are not guaranteed or promised. Please refer to it for reference only Verify the content yourself.
Copyright belongs to the author.
For commercial reprints, please contact the author for authorization. For non-commercial reprints, please indicate the source.
MyFxtops迈投(www.myfxtops.com)-靠谱的外汇跟单社区,免费跟随高手做交易!
免责声明:本文系转载自网络,如有侵犯,请联系我们立即删除,另:本文仅代表作者个人观点,与迈投财经无关。其原创性以及文中陈述文字和内容未经本站证实,对本文以及其中全部或者部分内容、文字的真实性、完整性、及时性本站不作任何保证或承诺,请读者仅作参考,并请自行核实相关内容。
著作权归作者所有。
商业转载请联系作者获得授权,非商业转载请注明出处。