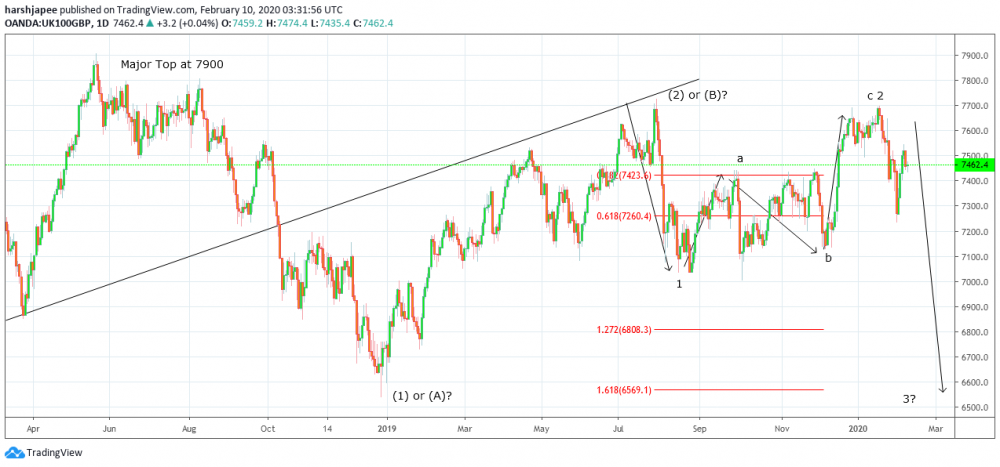
Bottom line: FTSE overall bearish structure remains intact until prices stay below 7724 levels. Bears need to break below 7100 to accelerate.
Technical Analysis:
FTSE retraced to fibonacci 0.618 levels of the recent drop from 7696 through 7236 and potential remains for a bearish resumption from current levels (7450/7500). Looking at the short term wave structure since 7696 highs, FTSE seems to have dropped into 5 waves towards 7262. The subsequent rally is corrective and stalled around the fibonacci 0.618 retracement as well. If the above counts are correct, FTSE should remain below 7696 and reverse sharply lower towards 6569 and further respectively. Alternately, a push above 7696 would be a threat to 7724 resistance, and we might have to adjust counts accordingly. It remains to be seen how FTSE reacts around current levels before the alternate scenario comes into play. Most traders might be willing to remain short with protective stops above 7724 resistance and projected targets below 6569 respectively. The overall wave structure still remains intact with bears looking to remain in control. FTSE has produced a 5-3 pattern towards the south side since 7904 highs. Ideal formation should be another 5 waves lower before reversing. The drop from 7904 through 6539 was in 5 waves labelled as Wave (1); which was followed by a corrective rally towards 7696, labelled as Wave (2) here. If the above counts are correct, FTSE should remain below 7696 levels and push towards 6569 as Wave (3) progresses. Alternately, if bears are unable to break below 7100 interim support, the indice could be unfolding towards 7724 and higher before reversing lower again. With most indices printing fresh highs, it is a great bearish divergence scenario as FTSE trades below 7904 levels. It is also an indication of a potential reversal across world indices.
Prepared by
Harsh Japee, Technical Analyst.
FTSE Chart
MyFxtops 邁投 (www.myfxtops.com) -Reliable Forex Copy Trade community, follow the master for free to trade!
Disclaimer: This article is reproduced from the Internet. If there is any infringement, please contact us to delete it immediately. In addition: This article only represents the personal opinion of the author and has nothing to do with Mato Finance The originality and the text and content stated in this article have not been confirmed by this site. The authenticity, completeness and timeliness of this article and all or part of the content and text are not guaranteed or promised. Please refer to it for reference only Verify the content yourself.
Copyright belongs to the author.
For commercial reprints, please contact the author for authorization. For non-commercial reprints, please indicate the source.
MyFxtops迈投(www.myfxtops.com)-靠谱的外汇跟单社区,免费跟随高手做交易!
免责声明:本文系转载自网络,如有侵犯,请联系我们立即删除,另:本文仅代表作者个人观点,与迈投财经无关。其原创性以及文中陈述文字和内容未经本站证实,对本文以及其中全部或者部分内容、文字的真实性、完整性、及时性本站不作任何保证或承诺,请读者仅作参考,并请自行核实相关内容。
著作权归作者所有。
商业转载请联系作者获得授权,非商业转载请注明出处。