Bottom line: GBPUSD bullish structure remain intact until prices stay above 1.1950. The corrective drop could be complete at 1.2850 or close to completion around 1.2750 respectively.
Technical Analysis:
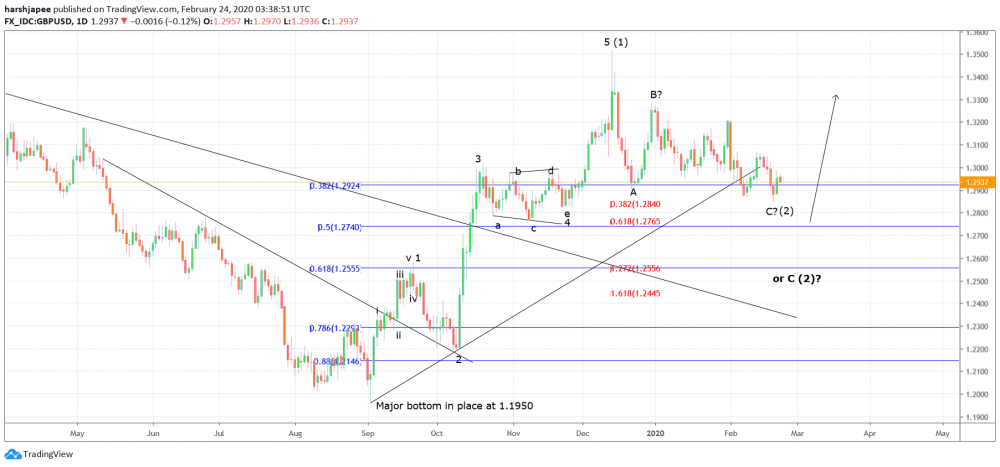
GBPUSD has taken almost 10 weeks for the proposed corrective phase since printing highs at 1.3515 levels on December 13, 2019. The single currency has print fresh lows at 1.2850 on February 21, 2020, and could be possible to have completed its corrective phase A-B-C. Out of the many correlations for Wave (2) termination, 1.2850 is very close to 1.2828, the wave iv termination of one lesser degree. Please note that a minimum criteria for Wave (2) termination has already been met after GBPUSD dropped below 1.2900 and terminated close to wave iv of a lesser degree at 1.2850. A push above 1.3080 which is immediate resistance, could confirm that GBPUSD might have bottomed and continue its Wave (3) rally from here. Alternately, a drop below 1.2850 open up possibilities to drop towards 1.2750 and subsequently towards the 1.2550 mark, before Wave (2) terminates. In either case, the overall larger degree structure remain intact and it is just a matter of time before Wave (3) rally resumes. Please note that there are a couple of convergences seen around the 1.2550 region as well. The Fibonacci 0.618 retracement of previous rally and the past resistance turned support zone as well. Most traders might be looking to enter long positions between 1.2550/1.2750 levels with protective stops at 1.1950 and potential price targets towards 1.4250/1.4500 levels respectively. Looking at the larger wave counts since 1.1950 lows, the GBPUSD has clearly produced an impulse rally through 1.3515 levels, labelled as Wave (1). It is being followed by a 3 wave corrective drop A-B-C which could be complete at 1.2850 or should complete around 1.2750 levels respectively. Once the above is in place Wave (3) rally should push towards 1.4200 levels at least going forward. .
Prepared by
Harsh Japee, Technical Analyst.
GBPUSD Chart
MyFxtops 邁投 (www.myfxtops.com) -Reliable Forex Copy Trade community, follow the master for free to trade!
Disclaimer: This article is reproduced from the Internet. If there is any infringement, please contact us to delete it immediately. In addition: This article only represents the personal opinion of the author and has nothing to do with Mato Finance The originality and the text and content stated in this article have not been confirmed by this site. The authenticity, completeness and timeliness of this article and all or part of the content and text are not guaranteed or promised. Please refer to it for reference only Verify the content yourself.
Copyright belongs to the author.
For commercial reprints, please contact the author for authorization. For non-commercial reprints, please indicate the source.
MyFxtops迈投(www.myfxtops.com)-靠谱的外汇跟单社区,免费跟随高手做交易!
免责声明:本文系转载自网络,如有侵犯,请联系我们立即删除,另:本文仅代表作者个人观点,与迈投财经无关。其原创性以及文中陈述文字和内容未经本站证实,对本文以及其中全部或者部分内容、文字的真实性、完整性、及时性本站不作任何保证或承诺,请读者仅作参考,并请自行核实相关内容。
著作权归作者所有。
商业转载请联系作者获得授权,非商业转载请注明出处。