Bottom line: USDJPY produces a bearish bounce right at the triangle resistance. The structure looks bearish against 112.40 levels for now.
Technical Analysis:
USDJPY bears have come back sharp from 112.22 levels last week, just when it looked like the currency would run away breaking above 112.40 defined resistance earlier. Prices remained shy by just a few pips from 112.40 resistance and reacted right at the triangle resistance discussed last week. The immediate wave structure looks bearish at least towards the 108.00 zone. Looking at the overall wave counts, USDJPY could be still working on a bullish triangle with Waves A, B, C and D already in place at 99.00, 118.66, 105.26, 114.55 respectively and Wave E is also producing a triangle structure before breaking higher. If the above counts are correct, Wave E is working on its last leg lower (wave e) potentially expected to terminate around 108.00 levels. After that USDJPY could reverse and break higher above the 112.40 mark. Alternately, since 112.40 still remains intact, USDJPY might still drop close to 104.50 levels to complete a 5-3-5 wave structure before turning higher again. Probabilities are higher for a reversal from close to 108.00 levels for now. Looking at the immediate wave structure since 112.22 highs, USDJPY might have produces its first wave lower and could be preparing for a pullback, to carve a lower degree wave b before resuming lower again. The Fibonacci 0.618 resistance of the recent drop between 112.22 and 109.89 is seen at 111.37 levels. Most traders might be preparing to initiate fresh short positions there, with protective stop above 112.40 and potential targets below 108.50 respectively. Please note that potential remains for a drop towards 107.50 levels before a bullish reversal. USDJPY remains potential candidate to sell on rallies against 112.40 levels.
Prepared by
Harsh Japee, Technical Analyst.
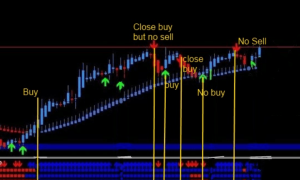
USDJPY Chart

MyFxtops 邁投 (www.myfxtops.com) -Reliable Forex Copy Trade community, follow the master for free to trade!
Disclaimer: This article is reproduced from the Internet. If there is any infringement, please contact us to delete it immediately. In addition: This article only represents the personal opinion of the author and has nothing to do with Mato Finance The originality and the text and content stated in this article have not been confirmed by this site. The authenticity, completeness and timeliness of this article and all or part of the content and text are not guaranteed or promised. Please refer to it for reference only Verify the content yourself.
Copyright belongs to the author.
For commercial reprints, please contact the author for authorization. For non-commercial reprints, please indicate the source.
MyFxtops迈投(www.myfxtops.com)-靠谱的外汇跟单社区,免费跟随高手做交易!
免责声明:本文系转载自网络,如有侵犯,请联系我们立即删除,另:本文仅代表作者个人观点,与迈投财经无关。其原创性以及文中陈述文字和内容未经本站证实,对本文以及其中全部或者部分内容、文字的真实性、完整性、及时性本站不作任何保证或承诺,请读者仅作参考,并请自行核实相关内容。
著作权归作者所有。
商业转载请联系作者获得授权,非商业转载请注明出处。