Bottom line: SPX500 bearish structure is intact until prices stay below 3400 levels going forward. Bears seem to be poised to drag prices further below 2300 levels before producing any meaningful rally.
Technical Analysis:
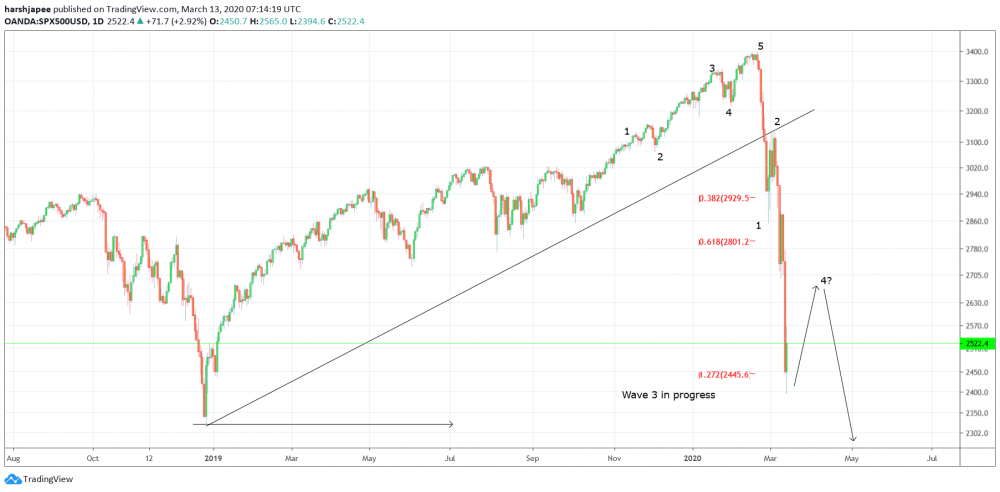
SPX500 has been presented today, as we re-look into US and European markets amidst huge selloff accompanied by the Corona scare across the globe. We present the potential wave counts again to project short to medium term outlook. After having terminating 5 waves around 3400 mark around February 19, 2020 the SPX500 has been completely in control of bears. The first sharp drop between 3400 and 2854 was an impulse labelled as Wave 1 here. Wave 2 was a sharp corrective rally towards 3101, which hit the back side of the support turned resistance trend line and also terminated around Fibonacci 50% retracement of Wave 1. Since then, Wave 3 has been progressing sharply lower and has carved lower degree waves i, ii and iii around 2697, 2880 and 2394 respectively. Please also note that it has reached the 1.271 Fibonacci extension of Wave 1at 2445 and has exceeded towards 2394 intraday lows, before reversing sharply. The recent intraday rally has been sharp appreciating the SPX500 by over 6% in a matter of few hours. It might seem to most traders that the indices has finally bottomed out and is ready to resume higher again. We would bring in a word of caution here as it might just be considered as a sharp lower degree wave iv, within Wave 3 drop. Please note that Wave 3 usually travels up to Fibonacci 1.618 distance of Wave 1 and it seems to be below 2300 mark. Wave iv is expected to terminate around 2582 levels, before SPX500 resumes lower again to move towards 2300 and lower to terminate Wave 3.
Prepared by
Harsh Japee, Technical Analyst.
SPX500 Chart
MyFxtops 邁投 (www.myfxtops.com) -Reliable Forex Copy Trade community, follow the master for free to trade!
Disclaimer: This article is reproduced from the Internet. If there is any infringement, please contact us to delete it immediately. In addition: This article only represents the personal opinion of the author and has nothing to do with Mato Finance The originality and the text and content stated in this article have not been confirmed by this site. The authenticity, completeness and timeliness of this article and all or part of the content and text are not guaranteed or promised. Please refer to it for reference only Verify the content yourself.
Copyright belongs to the author.
For commercial reprints, please contact the author for authorization. For non-commercial reprints, please indicate the source.
MyFxtops迈投(www.myfxtops.com)-靠谱的外汇跟单社区,免费跟随高手做交易!
免责声明:本文系转载自网络,如有侵犯,请联系我们立即删除,另:本文仅代表作者个人观点,与迈投财经无关。其原创性以及文中陈述文字和内容未经本站证实,对本文以及其中全部或者部分内容、文字的真实性、完整性、及时性本站不作任何保证或承诺,请读者仅作参考,并请自行核实相关内容。
著作权归作者所有。
商业转载请联系作者获得授权,非商业转载请注明出处。