Bottom line: Dow Jones bearish structure remains very much intact until 29600 is in place. Any rallies should be treated as counter trends and opportunities to initiate further short positions.
Technical Analysis:
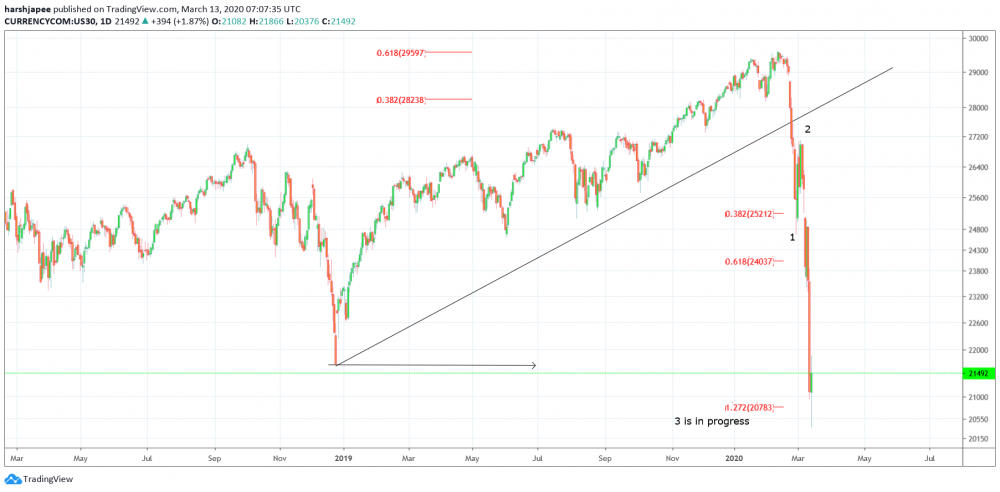
Dow Jones is firmly in control of bears since 29600 highs on February 12, 2020 as discussed earlier. We bring you the potential wave counts and the way forward, that would help take informed decisions. In our last discussions, we had projected price action around the 21600 mark and below. Dow Jones has achieved that in a flash which is quite normal for 3rd waves; with Corona panic aggravating the situation further. Sticking to the wave counts going forward, here is the most probable one: The drop between 29600 and 25500 has been labelled as Wave 1 as it unfolded sharply as an impulse. Wave 2 correction was sharp towards 27095 levels, followed by a resumption lower as Wave 3. The sub waves within Wave 3 are not shown here but, the counts are clearly suggesting that Wave 3 is still in progress and could possibly terminate around the 19000 mark going forward. Dow Jones had dropped earlier today around the 20400 mark, pretty close to 1.271 extension of Wave 1, as displayed on the chart here. The sharp rally after intraday lows has covered much losses and has raised towards 21930 levels at this point in writing. An 800 point rally might look quite intimidating to most traders, and might trigger emotional buying considering the severe drop. Technically, this rally seems to be lower degree wave iv, within Wave 3 and is expected to find resistance around 22150/200 levels. The down trend might be resuming from 22150/200 levels, as Dow Jones prepares to unfold wave v lower towards 19000 levels to complete higher degree Wave 3. If the count is correct, prices are expected to stay below 23450 levels.
Prepared by
Harsh Japee, Technical Analyst.
Dow Jones Chart
MyFxtops 邁投 (www.myfxtops.com) -Reliable Forex Copy Trade community, follow the master for free to trade!
Disclaimer: This article is reproduced from the Internet. If there is any infringement, please contact us to delete it immediately. In addition: This article only represents the personal opinion of the author and has nothing to do with Mato Finance The originality and the text and content stated in this article have not been confirmed by this site. The authenticity, completeness and timeliness of this article and all or part of the content and text are not guaranteed or promised. Please refer to it for reference only Verify the content yourself.
Copyright belongs to the author.
For commercial reprints, please contact the author for authorization. For non-commercial reprints, please indicate the source.
MyFxtops迈投(www.myfxtops.com)-靠谱的外汇跟单社区,免费跟随高手做交易!
免责声明:本文系转载自网络,如有侵犯,请联系我们立即删除,另:本文仅代表作者个人观点,与迈投财经无关。其原创性以及文中陈述文字和内容未经本站证实,对本文以及其中全部或者部分内容、文字的真实性、完整性、及时性本站不作任何保证或承诺,请读者仅作参考,并请自行核实相关内容。
著作权归作者所有。
商业转载请联系作者获得授权,非商业转载请注明出处。