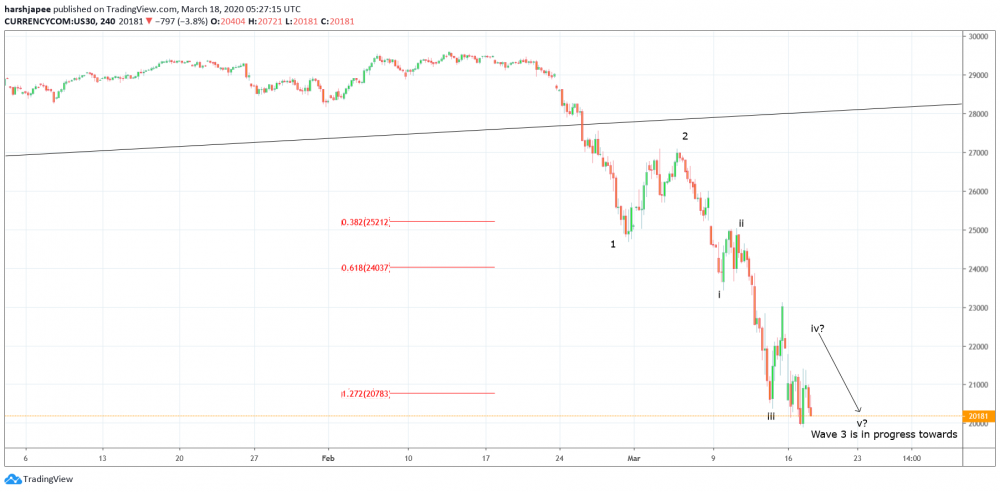
Bottom line: Dow Jones bearish setup firmly intact with major top in place at 29600 levels. Watch out for another push lower through 19000 levels as Wave (3) terminates.
Technical Analysis:
Dow Jones remains in control of bears since the 29600 highs print on February 12, 2020. Last Friday, we had presented potential wave counts and price action until now confirms the same. Let us re-look at the immediate wave structure since 29600 levels. The drop between 29600 through 24695 levels was an impulse, labelled as Wave 1 on the 4H chart here. Subsequent sharp rally towards 27095 has been labelled as Wave 2. Since then, Wave 3 has been unfolding and the sub waves are pretty clear as described below. Wave I dropped until 23444, while wave ii was again sharp towards 25039 levels. Going further, wave iii terminated at 20376 and a sideways wave iv is unfolding at this moment in writing with potential termination seen close to 22000 levels going forward. Please note that wave iv could be unfolding as a triangle or running flat since wave ii was sharp. Once wave iv is in place, Dow Jones is expected to produce a thrust wave v lower towards 19000 levels to terminate Wave 3 as discussed above. If the Dow settles around 19000 levels, the entire drop could be seen as corrective but if an impulse is underway from 29600 levels, we could witness Wave 4 corrective rally towards 23000 levels, before Wave 5 drop lower again. Believe it or not, the latter scenario remains high probability hence most traders might be willing to sell on corrective rallies rather than initiate aggressive long positions. Watch out for a drop towards 19000 levels as immediate target before pulling back towards 22000/23000 again.
Prepared by
Harsh Japee, Technical Analyst.
Dow Jones Chart
MyFxtops 邁投 (www.myfxtops.com) -Reliable Forex Copy Trade community, follow the master for free to trade!
Disclaimer: This article is reproduced from the Internet. If there is any infringement, please contact us to delete it immediately. In addition: This article only represents the personal opinion of the author and has nothing to do with Mato Finance The originality and the text and content stated in this article have not been confirmed by this site. The authenticity, completeness and timeliness of this article and all or part of the content and text are not guaranteed or promised. Please refer to it for reference only Verify the content yourself.
Copyright belongs to the author.
For commercial reprints, please contact the author for authorization. For non-commercial reprints, please indicate the source.
MyFxtops迈投(www.myfxtops.com)-靠谱的外汇跟单社区,免费跟随高手做交易!
免责声明:本文系转载自网络,如有侵犯,请联系我们立即删除,另:本文仅代表作者个人观点,与迈投财经无关。其原创性以及文中陈述文字和内容未经本站证实,对本文以及其中全部或者部分内容、文字的真实性、完整性、及时性本站不作任何保证或承诺,请读者仅作参考,并请自行核实相关内容。
著作权归作者所有。
商业转载请联系作者获得授权,非商业转载请注明出处。