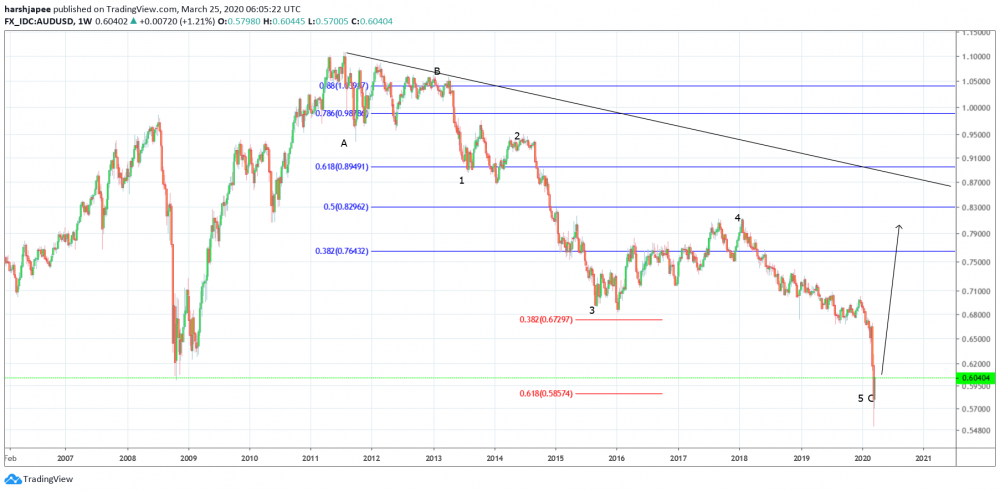
Bottom line: AUDUSD remains bullish against 0.5900 levels, going forward. The rally is expected to be sharp as initial resistance is seen through 0.6700 levels.
Technical Analysis:
AUDUSD prints an intermediary bottom around 0.5500 levels, about 300 pips below the projected support at 0.5800/50 levels last week. We again bring a bigger picture through weekly chart setups and potential counts. The wave counts might be suggesting that AUDUSD bears have managed to carve an A-B-C drop between 1.1000 and 0.5500 levels between July 2011 and March 2020. This corrective drop may be a part of a larger corrective structure (W)-(X)-(Y). If the above counts are correct at a larger degree, AUDUSD could be unfolding a potential 5-3-5 structure on the higher side, to complete Wave (Y) within the larger form. Hence, the bottom formed on March 16, 2020 could hold for a longer time, allowing a zigzag corrective rally to be complete at a higher degree. Please note that the corrective rally may travel a distance up to 61.8 percent of Wave (X) between 1.1000 and 0.5500 respectively. The first potential target may be seen towards 0.7500/7600 levels, which is fibonacci 0.382 retracement of previous drop. If the above larger wave counts hold true, most traders might be willing to initiate fresh long positions, with protective stops just below 0.5500 and projected targets around 0.7600 levels respectively. Looking at the lower degree, we still need to see an impulse rally to materialize from 0.5500 lows to confirm a potential trend reversal. More conservative trading strategy might be to remain flat for now and allow 5 waves structure on the hourly chart. Please note that a break above initial resistance at 0.6700 would be constructive for bulls. Once the above price action is confirmed, it might be good to buy AUDUSD on dips.
Prepared by
Harsh Japee, Technical Analyst.
AUDUSD Chart
MyFxtops 邁投 (www.myfxtops.com) -Reliable Forex Copy Trade community, follow the master for free to trade!
Disclaimer: This article is reproduced from the Internet. If there is any infringement, please contact us to delete it immediately. In addition: This article only represents the personal opinion of the author and has nothing to do with Mato Finance The originality and the text and content stated in this article have not been confirmed by this site. The authenticity, completeness and timeliness of this article and all or part of the content and text are not guaranteed or promised. Please refer to it for reference only Verify the content yourself.
Copyright belongs to the author.
For commercial reprints, please contact the author for authorization. For non-commercial reprints, please indicate the source.
MyFxtops迈投(www.myfxtops.com)-靠谱的外汇跟单社区,免费跟随高手做交易!
免责声明:本文系转载自网络,如有侵犯,请联系我们立即删除,另:本文仅代表作者个人观点,与迈投财经无关。其原创性以及文中陈述文字和内容未经本站证实,对本文以及其中全部或者部分内容、文字的真实性、完整性、及时性本站不作任何保证或承诺,请读者仅作参考,并请自行核实相关内容。
著作权归作者所有。
商业转载请联系作者获得授权,非商业转载请注明出处。