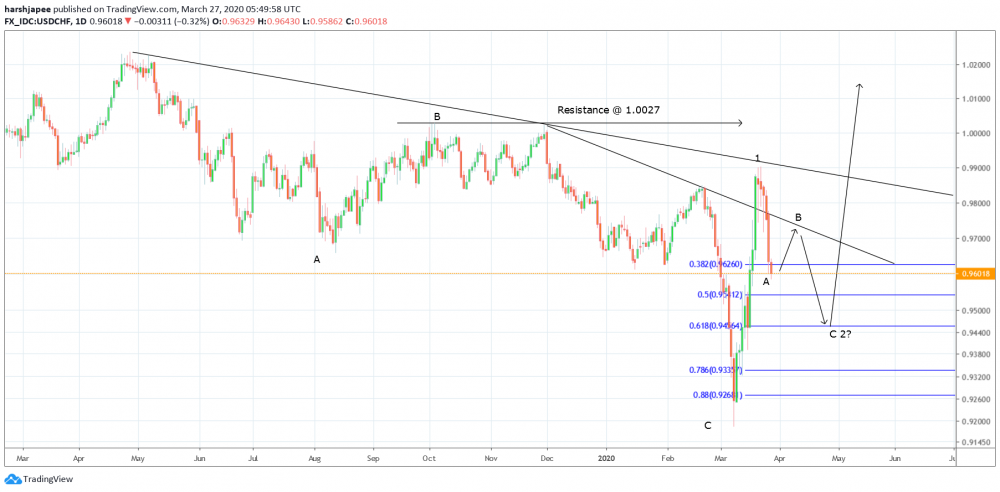
Bottom line: USDCHF might be retracing lower after printing highs at 0.9900 levels. Intraday rallies could be capped below 0.9780/0.9800 levels, before the drop could resume.
Technical Analysis:
USDCHF seems to be in a corrective phase after printing highs at 0.9900 levels on March 23, 2020. The rally between 0.9185 and 0.9900 was very sharp and bulls were able to take out immediate resistance at 0.9848 levels. The corrective drop from 0.9900 levels, might reach around 0.9456, which is 0.618 retracement of the previous rally.
At this point in writing, USDCHF has dropped until the fibonacci 0.382 retracement, and is expected to pullback towards the 0.9700/80 handle before continuing lower again. Interim resistance is now seen at 0.9900 levels and prices are is expected to remain well capped below the mark. The short term trend might be lower from here, at least towards 0.9450/60 levels.
Alternately, if bears are able to break below 0.9330 handle consistently, probability for a re-test of 0.9185 levels remains high. At the moment, most traders might be willing to go short on a pullback towards 0.9700/0.9780 levels, with a protective stop above 0.9900 and projected target around 0.9450/60 respectively.
Looking at the medium term wave structure, the entire drop from 1.0237 through 0.9185 can be seen in 3 waves, hence could be corrective. If the above structure holds, USDCHF bulls would remain poised to take out 1.0237 resistance, the April 23, 2019 highs going forward.
Overall structure is expected to remain in control of bulls until prices stay above the 0.9185 mark. Once the above corrective drop is terminated around 0.9450/60 levels, most traders might be looking to initiate long positions with protective stops below 0.9185. The projected upside target would exceed 1.0237 levels, going forward. Only a break below 0.9185 would nullify the above bullish structure.
Prepared by
Harsh Japee, Technical Analyst.
USDCHF Chart
MyFxtops 邁投 (www.myfxtops.com) -Reliable Forex Copy Trade community, follow the master for free to trade!
Disclaimer: This article is reproduced from the Internet. If there is any infringement, please contact us to delete it immediately. In addition: This article only represents the personal opinion of the author and has nothing to do with Mato Finance The originality and the text and content stated in this article have not been confirmed by this site. The authenticity, completeness and timeliness of this article and all or part of the content and text are not guaranteed or promised. Please refer to it for reference only Verify the content yourself.
Copyright belongs to the author.
For commercial reprints, please contact the author for authorization. For non-commercial reprints, please indicate the source.
MyFxtops迈投(www.myfxtops.com)-靠谱的外汇跟单社区,免费跟随高手做交易!
免责声明:本文系转载自网络,如有侵犯,请联系我们立即删除,另:本文仅代表作者个人观点,与迈投财经无关。其原创性以及文中陈述文字和内容未经本站证实,对本文以及其中全部或者部分内容、文字的真实性、完整性、及时性本站不作任何保证或承诺,请读者仅作参考,并请自行核实相关内容。
著作权归作者所有。
商业转载请联系作者获得授权,非商业转载请注明出处。