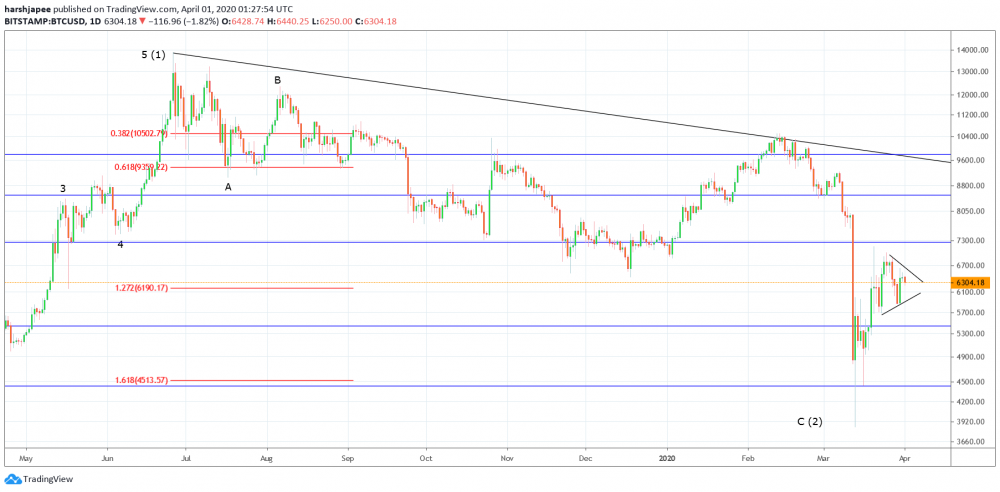
Bottom line: Bitcoin triangle consolidation might be in its last leg and is expected to find support around 6000/100 levels. A breakout on the north side is then expected to reach up to 8000 levels.
Technical Analysis:
Bitcoin bulls might be consolidating at the moment before producing a bullish breakout towards 8000 levels. Also note that the last wave within the triangle could find support around 6100 levels before reversing higher.
Immediate price resistance is seen through 8859 levels, March 07 highs; and bulls might be targeting to break higher. This would confirm a trend reversal and also note that the rally from 3850 would complete 5 waves. Most conservative traders might be prepared to buy on dips thereafter.
Aggressive traders might be preparing to initiate fresh long positions around 6000 levels, with a protective stop at 4400. The projected targets could be 8000 and 8850 respectively. A meaningful corrective drop can be expected after Bitcoin hits above 8000 as discussed.
The overall wave structure remains constructive for bulls until prices stay above 3000 support, the December 2018 lows. Please note the rally between 3000 and 13800 was an impulse (5 waves) and what has followed is a complex corrective structure towards 3850. Ideally, Bitcoin is expected to remain above December 2018 lows at 3000.
Also note that the corrective drop has retraced the entire previous rally between 3000 and 13800 by over 88%. This is the final fibonacci support zone and any further drop below 3850 would be a threat to the above bullish structure.
Furthermore, bulls have managed to bounce from the past resistance turned support zone around 4000. Probabilities remain high for a continued rally towards 8000 levels, and complete initial impulse wave.
Overall, Bitcoin structure remains constructive for bulls above 3850 levels. Watch out for a triangle breakout towards 8000 levels in the short term.
Prepared by
Harsh Japee, Technical Analyst.
Bitcoin Chart
MyFxtops 邁投 (www.myfxtops.com) -Reliable Forex Copy Trade community, follow the master for free to trade!
Disclaimer: This article is reproduced from the Internet. If there is any infringement, please contact us to delete it immediately. In addition: This article only represents the personal opinion of the author and has nothing to do with Mato Finance The originality and the text and content stated in this article have not been confirmed by this site. The authenticity, completeness and timeliness of this article and all or part of the content and text are not guaranteed or promised. Please refer to it for reference only Verify the content yourself.
Copyright belongs to the author.
For commercial reprints, please contact the author for authorization. For non-commercial reprints, please indicate the source.
MyFxtops迈投(www.myfxtops.com)-靠谱的外汇跟单社区,免费跟随高手做交易!
免责声明:本文系转载自网络,如有侵犯,请联系我们立即删除,另:本文仅代表作者个人观点,与迈投财经无关。其原创性以及文中陈述文字和内容未经本站证实,对本文以及其中全部或者部分内容、文字的真实性、完整性、及时性本站不作任何保证或承诺,请读者仅作参考,并请自行核实相关内容。
著作权归作者所有。
商业转载请联系作者获得授权,非商业转载请注明出处。