Bottom line: AUDUSD long term structure remains bullish against 0.5505 lows since March 2020. The currency has managed to print yet another high around 0.7413 yesterday before pulling back. Bears might remain poised to take control back from here.
Fundamental Outlook:
Dow Jones had rallied yesterday to close around 28674, up above +0.88%. The rally was backed by an upbeat ISM manufacturing PMI, printing 56.00. This clearly suggests that the manufacturing sector continues to expand. Over the next few sessions though, the indice might face renewed selling pressure around 29000/200 mark.
AUDUSD had print above the 0.7400 mark yesterday before pulling back. The exchange rate has dropped to 0.7355 as we prepare to publish the update, and might come under further pressure as Q2 GDP disappoints.
It has contracted by -7% against expectations of -5.9%, pushing the economy into a recession. Further the Reserve Bank of Australia has kept the official cash rate (OCR) unchanged to 0.25%. Adding further pressure on the exchange rate are the rising trade tensions with China.
Bitcoin had peaked through 12473 highs on August 17, 2020. Since then the crypto has dropped to 11100 lows before finding some support. The crypto trades around 11800 mark as we prepare this update, and might come under further pressure if US Dollar gains over the next several weeks.
Technical Analysis:
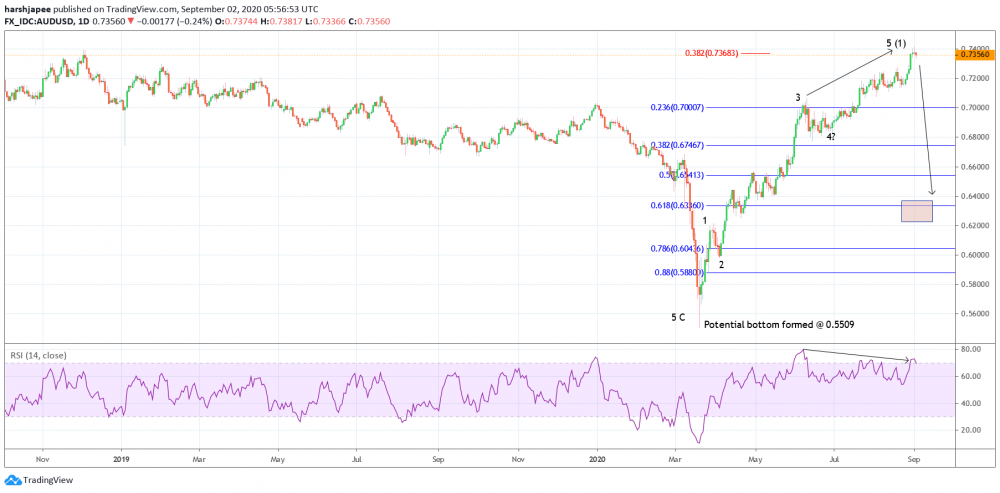
AUDUSD has managed to print yet another high around 0.7413 yesterday. Please note bulls have taken out a major past resistance at 0.9400 handle. A meaningful corrective drop might be high probability from here on. Break below 0.7150 interim support would confirm a bearish turn.
AUDUSD had dropped through 0.5505 lows in March 2020, and since then have remained in control of bulls. The currency has managed to carve a series of higher highs and higher lows towards 0.7413 highs registered yesterday. The rally seems to be an impulse wave, which should be followed by a corrective pullback.
Also note that fibonacci 0.618 support of the entire rally is seen towards 0.6350 levels. High probability remains for a bullish bounce, if prices manage to reach there. Most traders might be preparing to stand aside for a while and might consider longs near support around 0.6350 levels.
Prepared by
Harsh Japee, Technical Analyst.
AUDUSD Chart
MyFxtops 邁投 (www.myfxtops.com) -Reliable Forex Copy Trade community, follow the master for free to trade!
Disclaimer: This article is reproduced from the Internet. If there is any infringement, please contact us to delete it immediately. In addition: This article only represents the personal opinion of the author and has nothing to do with Mato Finance The originality and the text and content stated in this article have not been confirmed by this site. The authenticity, completeness and timeliness of this article and all or part of the content and text are not guaranteed or promised. Please refer to it for reference only Verify the content yourself.
Copyright belongs to the author.
For commercial reprints, please contact the author for authorization. For non-commercial reprints, please indicate the source.
MyFxtops迈投(www.myfxtops.com)-靠谱的外汇跟单社区,免费跟随高手做交易!
免责声明:本文系转载自网络,如有侵犯,请联系我们立即删除,另:本文仅代表作者个人观点,与迈投财经无关。其原创性以及文中陈述文字和内容未经本站证实,对本文以及其中全部或者部分内容、文字的真实性、完整性、及时性本站不作任何保证或承诺,请读者仅作参考,并请自行核实相关内容。
著作权归作者所有。
商业转载请联系作者获得授权,非商业转载请注明出处。