Bottom line: Ethereum long term structure continues to remain bullish against 89.50 lows. Over the short term though, the crypto might be preparing to drop towards 250.00 mark. Bears might want to remain in control from here on.
Fundamental Outlook:
USDCHF had pushed close to 0.9150 mark before pulling back yesterday. The exchange rate might be set to gain further as US Dollar continued its rally against EURO, GBP and others majors. The US Dollar Index (DXY) also managed to register above 93.00 mark.
The US and European indices tumbled during the New York session and Asian Markets might follow suit. Risk aversion might gain further traction over the next few weeks as geopolitical tensions between US and China keeps rising, the recent being China’s Chip Policy.
The upcoming US Presidential Election might add further to the volatility as Biden continues to lead Trump, marginally though. Safe haven US Dollar might be the only beneficiary if risk assets continue selloff. Dow Jones closed -2.42%, SPX500 at -3.5%, DAX down -1.4% and FTSE was down -2.60%.
Technical Analysis:
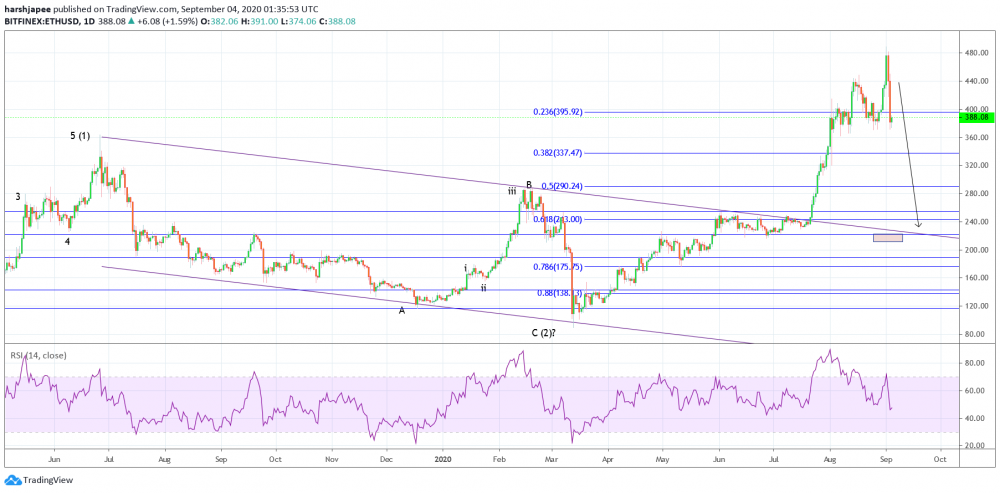
Ethereum bulls managed to push through 488.00 levels early this week, only to reverse sharply. The crypto has registered lows at 371.00 since then and might have carved a meaningful top already. Immediate support around 370.00/371.00 has been already taken out.
Ethereum bulls have managed to produce a religious uptrend since its lows around 89.50 levels in March 2020. It has carved a meaningful bullish boundary between 89.50 and 488.00 levels respectively. The rally seems to be an impulse wave, which should be followed by a corrective drop.
Furthermore, as Ethereum rose to new highs around 488.00 early this week, the RSI on daily chart was reflecting strong bearish divergence. The reversal to 371.00 lows might have confirmed that a meaningful corrective drop could be on its way.
Also note that fibonacci 0.618 retracement of the entire rally between 89.50 and 488.00 is seen through 245.00/250.00 levels. High probability remains for a bullish bounce, if prices manage to reach there. Most traders might be preparing to sell close to resistance around 440.00.
Prepared by
Harsh Japee, Technical Analyst.
Ethereum Chart
MyFxtops 邁投 (www.myfxtops.com) -Reliable Forex Copy Trade community, follow the master for free to trade!
Disclaimer: This article is reproduced from the Internet. If there is any infringement, please contact us to delete it immediately. In addition: This article only represents the personal opinion of the author and has nothing to do with Mato Finance The originality and the text and content stated in this article have not been confirmed by this site. The authenticity, completeness and timeliness of this article and all or part of the content and text are not guaranteed or promised. Please refer to it for reference only Verify the content yourself.
Copyright belongs to the author.
For commercial reprints, please contact the author for authorization. For non-commercial reprints, please indicate the source.
MyFxtops迈投(www.myfxtops.com)-靠谱的外汇跟单社区,免费跟随高手做交易!
免责声明:本文系转载自网络,如有侵犯,请联系我们立即删除,另:本文仅代表作者个人观点,与迈投财经无关。其原创性以及文中陈述文字和内容未经本站证实,对本文以及其中全部或者部分内容、文字的真实性、完整性、及时性本站不作任何保证或承诺,请读者仅作参考,并请自行核实相关内容。
著作权归作者所有。
商业转载请联系作者获得授权,非商业转载请注明出处。