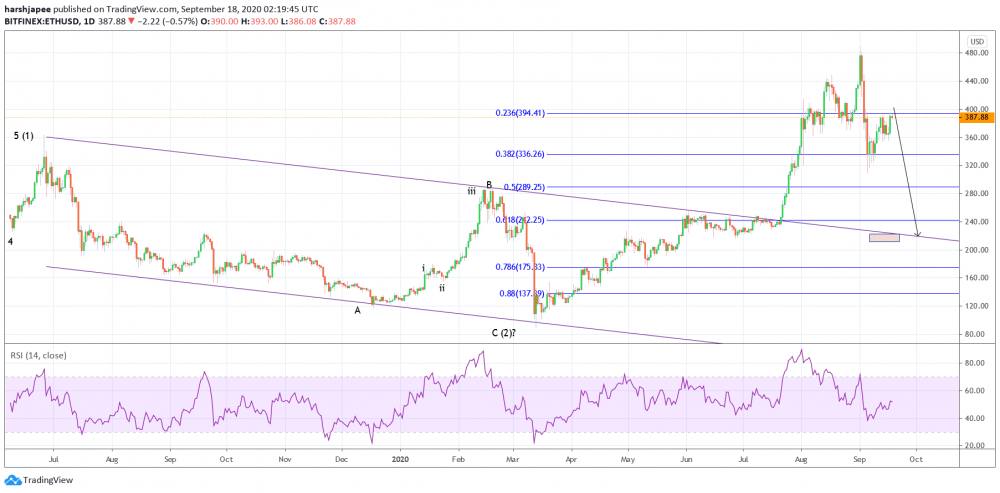
Bottom line: Ethereum long term structure remains bullish against 89.50 lows in March 2020. After having print 488.00 early this month, the crypto might be looking to carve a meaningful corrective drop towards 240.00/250.00 levels.
Fundamental Outlook:
USDCHF is holding above its 0.9000 lows carved earl this month. The exchange rate is trading close to 0.9080/85 levels as we prepare to publish and is expected to remain well bid over the next several weeks. The US Dollar Index (DXY) might be indicating further strength as it holds above 91.75 mark. Further, a return in risk aversion might only add to the US Dollar strength.
GBPJPY has dropped over 800 pips since 142.72 highs on September 01, 2020. The exchange rate had dropped through 134.50 yesterday before finding some bids. The Bank of England has keep rate decision unchanged to 0.1% and might be thinking to implement a negative interest rate policy.
The dovish stance by BoE, possibility of a hard or No-Brexit deal and fears of a second wave of COVID-19 infections might keep the exchange rate under pressure. GBPUSD had also dropped from its 1.3483 highs early this month to 1.2760 lows before finding some bids.
Technical Analysis:
Ethereum remains in control of bears since hitting 488.00 mark on September 01, 2020. After dropping sharply towards 310.00 levels, it has found interim support and produced a potential counter trend rally towards 394.00 levels. Bears might be preparing to resume lower towards 240.00/250.00 mark in the next several weeks.
Ethereum had managed to produce a religious uptrend after printing lows around 89.50 levels in March 2020. The rally could be classified as an impulse wave (consists of 5 sub-waves following certain guidelines). Also as discussed earlier, an impulse wave is ideally followed by a corrective wave towards the opposite direction.
Ethereum might be unfolding a meaningful corrective drop since 488.00 highs. The recent drop between 488.00 and 310.00 is being retraced and could reach up to 422.00, which is fibonacci 0.618 levels of the above drop. Bears might resume lower thereafter.
Also note that 240.00/250.00 zone is seen as fibonacci 0.618 retracement of the entire rally between 89.50 and 488.00 respectively. High probability remains for a bullish bounce if prices manage to reach there. Most traders might be preparing to initiate fresh longs in that region.
Prepared by
Harsh Japee, Technical Analyst.
Ethereum Chart
Disclaimer:
“This market commentary and analysis has been prepared for AT Global Markets UK Ltd (ATFX UK) by a third party for general information purposes only. Any view expressed does not constitute a personal recommendation or solicitation to buy or sell as it does not take into account your personal circumstances or objectives, and should therefore not be interpreted as financial, investment or other advice, or relied upon as such.
You should therefore seek independent advice before making any investment decisions. This information has not been prepared in accordance with legal requirements designed to promote the independence of investment research and as such is considered to be a marketing communication.
Although we are not specifically constrained from dealing ahead of our recommendations we do not seek to take advantage of them before they are provided to our clients. We aim to establish and maintain and operate effective organizational and administrative arrangements with a view to taking all reasonable steps to prevent conflicts of interest from constituting or giving rise to a material risk of damage to the interests of our clients.
The market data is derived from independent sources believed to be reliable, however we make no representation or warranty of its accuracy or completeness, and accept no responsibility for any consequence of its use by recipients. Reproduction of this information, in whole or in part, is not permitted.”
MyFxtops 邁投 (www.myfxtops.com) -Reliable Forex Copy Trade community, follow the master for free to trade!
Disclaimer: This article is reproduced from the Internet. If there is any infringement, please contact us to delete it immediately. In addition: This article only represents the personal opinion of the author and has nothing to do with Mato Finance The originality and the text and content stated in this article have not been confirmed by this site. The authenticity, completeness and timeliness of this article and all or part of the content and text are not guaranteed or promised. Please refer to it for reference only Verify the content yourself.
Copyright belongs to the author.
For commercial reprints, please contact the author for authorization. For non-commercial reprints, please indicate the source.
MyFxtops迈投(www.myfxtops.com)-靠谱的外汇跟单社区,免费跟随高手做交易!
免责声明:本文系转载自网络,如有侵犯,请联系我们立即删除,另:本文仅代表作者个人观点,与迈投财经无关。其原创性以及文中陈述文字和内容未经本站证实,对本文以及其中全部或者部分内容、文字的真实性、完整性、及时性本站不作任何保证或承诺,请读者仅作参考,并请自行核实相关内容。
著作权归作者所有。
商业转载请联系作者获得授权,非商业转载请注明出处。