
Bottom line: USDJPY bearish structure should prevail until prices stay below 110.70 levels, going forward. A potential Wave (2) termination at 109.72 still holds good and it remains to be seen if prices reverse from here.
Technical Analysis:
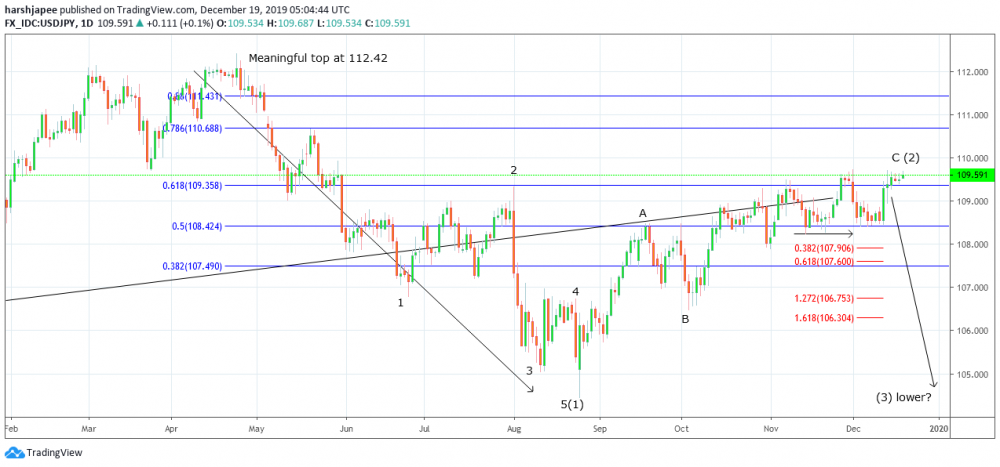
USDJPY bears potentially remain in control as 109.72 resistance holds good and the overall bearish structure would still remain intact until prices stay below 110.70, going forward. The medium term wave structure since 112.42 highs remain bearish as prices dropped 5 waves lower between 112.41 and 104.50, labelled as Wave (1) here. Furthermore, the rally between 104.50 and 109.72 has sub- divided into 3 waves A-B-C; labelled as Wave (2). If the above medium term wave structure holds well, prices should ideally stay below 110.70 mark (fibonacci 0.786 resistance of the previous drop), and push lower towards 104.50 and further, as Wave (3) sub-divides into 5 waves. Ideally, a classic 5-3-5 Elliott Wave pattern seems to be underway. Alternately, a consistent push above 110.70 levels would threaten to break above 112.42, invalidating the existing bearish structure. At the moment, a high probable trade direction from here is expected to be on the south side against 110.70, with potential price targets below 104.50. A break below 108.40 would confirm and accelerate the drop towards 106.30 and further, as highlighted here. Please note that a marginal push above 109.72 would still keep the above structure intake and one should remain short with potential stops placed above 110.70 levels. Immediate price resistance on the daily chart is seen just below 110.00, and test is possible before prices reverse. Watch out for a bearish reversal either from current price levels at 109.50/60 or from 110.00 levels, going forward. The US Dollar weakness expected across major currencies also falls in line with the above structure.
Prepared by
Harsh Japee, Technical Analyst
USDJPY Chart
MyFxtops 邁投 (www.myfxtops.com) -Reliable Forex Copy Trade community, follow the master for free to trade!
Disclaimer: This article is reproduced from the Internet. If there is any infringement, please contact us to delete it immediately. In addition: This article only represents the personal opinion of the author and has nothing to do with Mato Finance The originality and the text and content stated in this article have not been confirmed by this site. The authenticity, completeness and timeliness of this article and all or part of the content and text are not guaranteed or promised. Please refer to it for reference only Verify the content yourself.
Copyright belongs to the author.
For commercial reprints, please contact the author for authorization. For non-commercial reprints, please indicate the source.
MyFxtops迈投(www.myfxtops.com)-靠谱的外汇跟单社区,免费跟随高手做交易!
免责声明:本文系转载自网络,如有侵犯,请联系我们立即删除,另:本文仅代表作者个人观点,与迈投财经无关。其原创性以及文中陈述文字和内容未经本站证实,对本文以及其中全部或者部分内容、文字的真实性、完整性、及时性本站不作任何保证或承诺,请读者仅作参考,并请自行核实相关内容。
著作权归作者所有。
商业转载请联系作者获得授权,非商业转载请注明出处。


