
Bottom line: GBPUSD overall bullish structure remains intact till prices stay above 1.1950.
Technical Analysis:
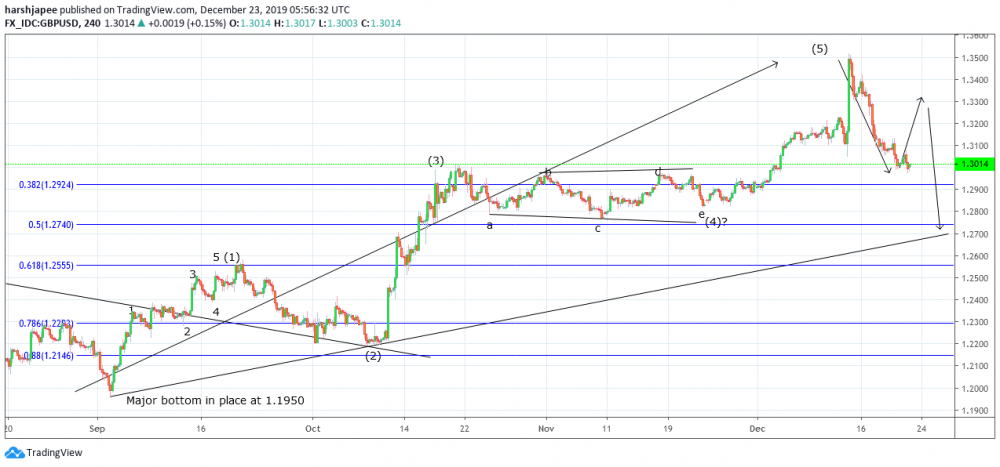
GBPUSD is correcting lower since 1.3515 highs print on December 12, 2019; and it seems as the first leg of correction might be over at 1.2977 last week. Please note that prices may drop to fibonacci 0.382 supports at 1.2928, before pulling back. The overall wave structure since 1.1950 lows has neatly unfolded into 5 waves through 1.3515 highs; labelled as Wave (1) here. If we consider this as first impulse since 1.1950 levels, a 3 wave corrective drop can be expected before the rally could resume. Alternately, if the current impulse is a part of an expanded flat, prices could drop below 1.1950, to continue the previous bearish trend. Looking at the short term wave structure, GBPUSD has managed to produce 5 waves between 1.3515 and 1.2977 respectively. This could be Wave A, within a potential zigzag corrective drop (5-3-5) from 1.3515. If the above count holds well, we could witness a corrective rally towards 1.3200, followed by a 5 wave drop towards 1.2700 levels at least. This would complete the corrective phase before Wave (3) could resume higher again. Trading opportunities can be on both sides and depending on one’s risk aptitude, positions can be taken. A more conservative trading approach could be to buy on dips towards 1.2700 through 1.2550 levels, against 1.1950, with potential targets above 1.4500 going forward. Immediate price support comes in around 1.2800/50, which is Wave (4) termination of one lesser degree; while interim resistance stays at 1.3515 levels respectively. Structurally, a bullish turn from around 1.2550/1.2700 levels, would resume Wave (3) at a higher degree and we can expect prices to rise sharply towards 1.4500. Also this could mark the end of a multiyear downtrend for GBPUSD.
Prepared by
Harsh Japee, Technical Analyst
GBPUSD Chart
MyFxtops 邁投 (www.myfxtops.com) -Reliable Forex Copy Trade community, follow the master for free to trade!
Disclaimer: This article is reproduced from the Internet. If there is any infringement, please contact us to delete it immediately. In addition: This article only represents the personal opinion of the author and has nothing to do with Mato Finance The originality and the text and content stated in this article have not been confirmed by this site. The authenticity, completeness and timeliness of this article and all or part of the content and text are not guaranteed or promised. Please refer to it for reference only Verify the content yourself.
Copyright belongs to the author.
For commercial reprints, please contact the author for authorization. For non-commercial reprints, please indicate the source.
MyFxtops迈投(www.myfxtops.com)-靠谱的外汇跟单社区,免费跟随高手做交易!
免责声明:本文系转载自网络,如有侵犯,请联系我们立即删除,另:本文仅代表作者个人观点,与迈投财经无关。其原创性以及文中陈述文字和内容未经本站证实,对本文以及其中全部或者部分内容、文字的真实性、完整性、及时性本站不作任何保证或承诺,请读者仅作参考,并请自行核实相关内容。
著作权归作者所有。
商业转载请联系作者获得授权,非商业转载请注明出处。


