
Bottom line: Gold remains bearish until prices stay below $1520 resistance. A bearish reversal here could drag prices below $1445.
Technical Analysis:
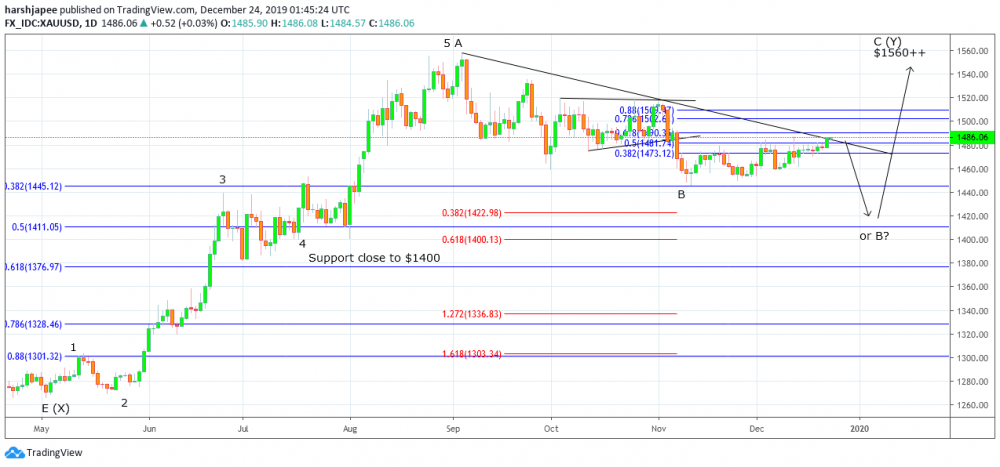
Gold is testing the fibonacci 0.618 retracement of the recent drop between $1520 through $1445 around $ 1490/91 levels respectively. A bearish reversal could be expected around these levels, pushing prices towards $1415 levels going ahead. Please also note that Gold is trading very close to the trend line resistance connecting previous highs at $1557 and $1520 respectively. A high probable trade setup from here could be on the south side, against $1520, with potential targets below $1445 and towards $1415 respectively. Alternately, a break above $1520 would be a confirmation that the yellow metal has formed a meaningful low at $1445 earlier and that bulls are poised to push towards $1580/90 levels to terminate Wave C within Wave (Y). Looking at the overall wave structure, Gold has been in a counter trend (W)-(X)-(Y) since $1046 lows carved in December 2015. Wave (X) had unfolded into a multiyear triangle setup terminating around $1260 levels in May 2019. Since then, Wave (Y) has been unfolding a 5-3-5 (A-B-C) wave structure. Please note that Wave A unfolded into 5 waves, between $1260 and $1557; Wave B potentially unfolded between $1557 and $1445 (it could still terminate around $1415 levels) respectively. If the above structure is true, Wave C of (Y) could be soon underway, from current levels or from $1415; towards $1557 and higher, going forward. A potential termination of Wave (Y) is seen towards the $1580/90 levels, which is also fibonacci 0.618 retracement of the earlier drop between $19xx and $1046 levels respectively. An aggressive trade setup from here could be on the south side with stops at $1520, while a more conservative approach could be to remain flat and look to buy lower around $1415 levels.
Prepared by
Harsh Japee, Technical Analyst
Gold Chart
MyFxtops 邁投 (www.myfxtops.com) -Reliable Forex Copy Trade community, follow the master for free to trade!
Disclaimer: This article is reproduced from the Internet. If there is any infringement, please contact us to delete it immediately. In addition: This article only represents the personal opinion of the author and has nothing to do with Mato Finance The originality and the text and content stated in this article have not been confirmed by this site. The authenticity, completeness and timeliness of this article and all or part of the content and text are not guaranteed or promised. Please refer to it for reference only Verify the content yourself.
Copyright belongs to the author.
For commercial reprints, please contact the author for authorization. For non-commercial reprints, please indicate the source.
MyFxtops迈投(www.myfxtops.com)-靠谱的外汇跟单社区,免费跟随高手做交易!
免责声明:本文系转载自网络,如有侵犯,请联系我们立即删除,另:本文仅代表作者个人观点,与迈投财经无关。其原创性以及文中陈述文字和内容未经本站证实,对本文以及其中全部或者部分内容、文字的真实性、完整性、及时性本站不作任何保证或承诺,请读者仅作参考,并请自行核实相关内容。
著作权归作者所有。
商业转载请联系作者获得授权,非商业转载请注明出处。


