
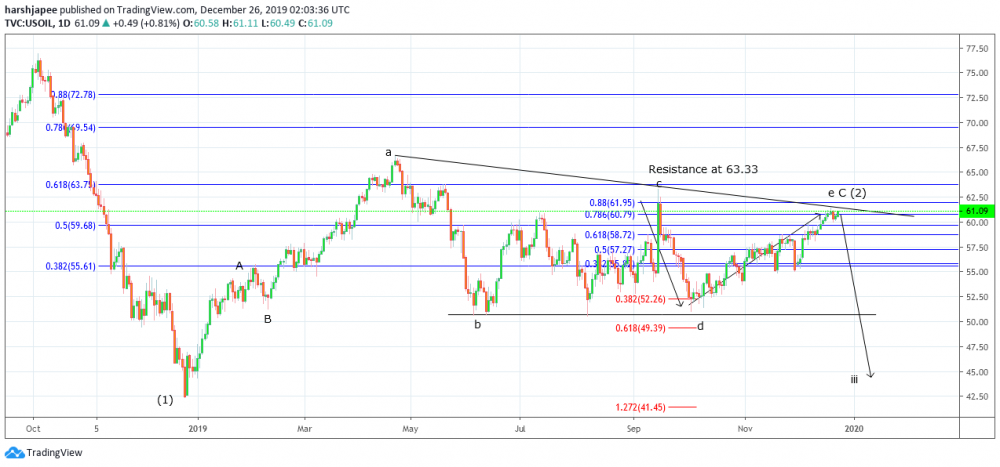
Bottom line: WTI Crude holds bearish structure until prices remain ideally below 63.33 levels, which is Wave c of the proposed triangle structure.
Technical Analysis:
WTI Crude high probable price action through Q1 2020 is that the triangle structure should be broken below 50.00, and push lower towards 41.00/42.00 levels going forward. For the above structure to hold, prices should ideally stay below 63.33 resistance, potential Wave c termination. Looking at the overall count since 76.88 highs, the drop towards 42.40 was an impulse (5 waves), labelled as Wave (1) here. The subsequent price action has been a series of 3 wave movement, and each leg has been defined as the triangle boundary a-b-c-d-e. The triangle consolidation has been decreasing resistance and constant support type (support zone is 50.50/51.00). WTI Crude might have terminated the last leg e, of the triangle at 61.38 levels; or might print another high below 63.33, before reversing lower. For now, Wave (2) potential triangle termination has been marked at 61.38 levels. If the above structure holds well, we should witness prices staying below 63.33 mark and reversing sharply lower to break below 50.50 mark. Hence, a high probable trade setup from here is expected to be on the south side, against 63.33, with potential targets below 50.50 and further towards 42.00 respectively; as we push through Q1 in 2020. Alternately, if prices fail to break below 50.50 and reverse higher towards 63.33, the above triangle structure would be invalid and another high above 66.60 levels could be expected. At the moment, we keep the bearish triangle view intact, while prices remain below 63.33, and expect breakout below 50.50. A push below 58.00 will confirm that prices have carved Wave e top at 61.38. Watch out for a bearish reversal around these levels (61.00/10).
Prepared by
Harsh Japee, Technical Analyst
WTI Crude Chart
MyFxtops 邁投 (www.myfxtops.com) -Reliable Forex Copy Trade community, follow the master for free to trade!
Disclaimer: This article is reproduced from the Internet. If there is any infringement, please contact us to delete it immediately. In addition: This article only represents the personal opinion of the author and has nothing to do with Mato Finance The originality and the text and content stated in this article have not been confirmed by this site. The authenticity, completeness and timeliness of this article and all or part of the content and text are not guaranteed or promised. Please refer to it for reference only Verify the content yourself.
Copyright belongs to the author.
For commercial reprints, please contact the author for authorization. For non-commercial reprints, please indicate the source.
MyFxtops迈投(www.myfxtops.com)-靠谱的外汇跟单社区,免费跟随高手做交易!
免责声明:本文系转载自网络,如有侵犯,请联系我们立即删除,另:本文仅代表作者个人观点,与迈投财经无关。其原创性以及文中陈述文字和内容未经本站证实,对本文以及其中全部或者部分内容、文字的真实性、完整性、及时性本站不作任何保证或承诺,请读者仅作参考,并请自行核实相关内容。
著作权归作者所有。
商业转载请联系作者获得授权,非商业转载请注明出处。


