
Bottom line: WTI Crude pushes above 63.33 resistances but overall bearish structure still remains intact as it moves towards a potential flat.
Technical Analysis:
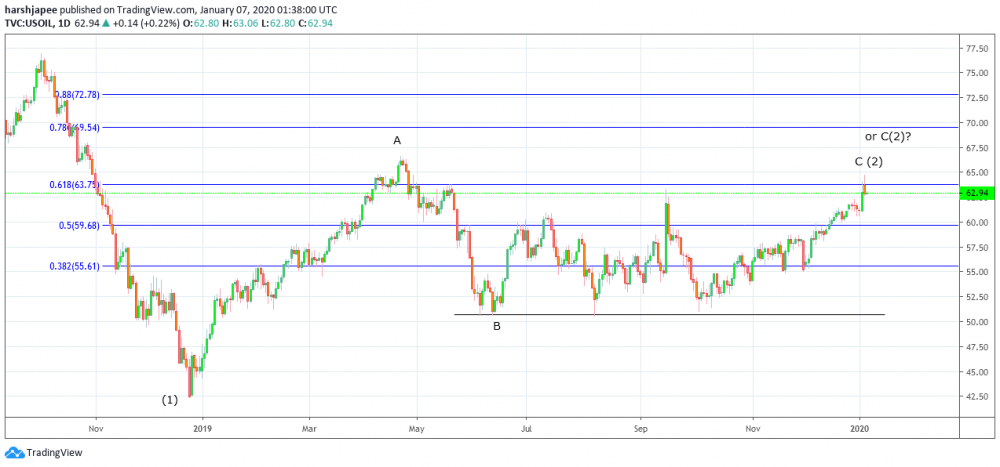
WTI Crude pushed above the 63.33 mark last week, nullifying the triangle count. At the moment, a standard or a running flat structure is expected to work out. In case of a standard flat, we would witness a further push towards 66.58 levels at least; while in case of a running flat, prices may reverse from current highs at 65.00 respectively. The overall wave structure still remains constructive for bears with an impulse drop between 76.88 and 42.40 still intact; labelled as Wave (1). As discussed earlier, corrective phase could be more complicated at times to identify potential patterns, since it could be a flat or triangle or zigzag or a combination. Objectively ruling out the others, a flat could be the most probable with price range around 65-66.50/67.00 respectively. To simplify the above corrective phase, we have re-labelled as an A-B- and potential C in the making around 65-66.50 levels, before Wave (2) could terminate. If the above structure holds well, prices should ideally stay below 69.50, and push lower towards 42.40 as Wave (3) progresses. Resistance for a potential Wave (2) termination could be seen around 66.90 levels and a bearish reversal can be expected. Alternately, if prices manage to push through 69.50 (probabilities are remote), the above bearish structure could be nullified. At the moment, a high probable trade direction could be lower from around 66.50-67.00 zone, against 69.50, with potential towards 42.40 in the coming weeks and months. A break below 60.66 which is initial price support, would confirm that a meaningful top is in place and that WTI Crude is heading lower again. A more conservative trading approach is to allow a break below 60.50 and then initiate short positions on corrective rallies thereafter.
Prepared by
Harsh Japee, Technical Analyst.
WTI Crude Chart
MyFxtops 邁投 (www.myfxtops.com) -Reliable Forex Copy Trade community, follow the master for free to trade!
Disclaimer: This article is reproduced from the Internet. If there is any infringement, please contact us to delete it immediately. In addition: This article only represents the personal opinion of the author and has nothing to do with Mato Finance The originality and the text and content stated in this article have not been confirmed by this site. The authenticity, completeness and timeliness of this article and all or part of the content and text are not guaranteed or promised. Please refer to it for reference only Verify the content yourself.
Copyright belongs to the author.
For commercial reprints, please contact the author for authorization. For non-commercial reprints, please indicate the source.
MyFxtops迈投(www.myfxtops.com)-靠谱的外汇跟单社区,免费跟随高手做交易!
免责声明:本文系转载自网络,如有侵犯,请联系我们立即删除,另:本文仅代表作者个人观点,与迈投财经无关。其原创性以及文中陈述文字和内容未经本站证实,对本文以及其中全部或者部分内容、文字的真实性、完整性、及时性本站不作任何保证或承诺,请读者仅作参考,并请自行核实相关内容。
著作权归作者所有。
商业转载请联系作者获得授权,非商业转载请注明出处。


