
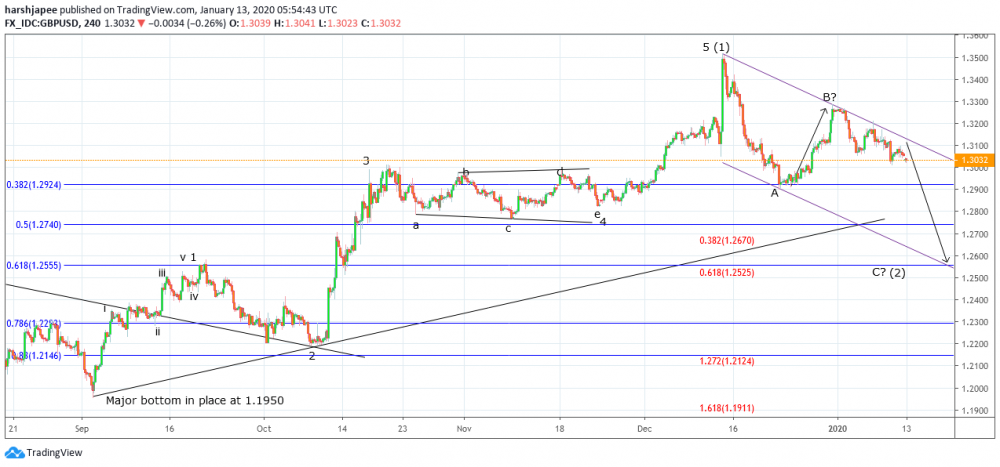
Bottom line: GBPUSD corrective phase seems to be into its final Wave C, and could drop towards 1.2550/1.2750 levels before finding support again.
Technical Analysis:
GBPUSD intermediary bearish move continues further as Wave C unfolding lower since 1.3284 highs earlier. Ideally, Wave C is expected to print below 1.2900 at least, to complete minimum requirement for a zigzag correction. Please note that GBPUSD has been producing a counter trend drop since 1.3515 highs, projected as A-B-C o the charts. The Elliott Channel for a potential Wave C termination is seen towards 1.2550 for now. This region is also marked as past resistance turned support along with the 61.8% retracement of the previous rally. Hence, a bullish reversal seems more likely around 1.2550/1.2750, if reached. Looking at the overall wave structure since 1.1950 lows, GBPUSD is near to competing a 5 Up and 3 Down structure. The rally between 1.1950 and 1.3515 unfolded into 5 waves labelled as Wave (1). It is being retraced by a corrective zigzag pattern A-B-C, and is expected to terminate below 1.2900 mark. This would be marked as potential Wave (2), expected to bottom around 1.2550/1.2750 zones. If the above structure holds well, prices should remain above 1.1950 and resume Wave (3) rally towards 1.4200 at least. Hence, a high probable trade setup is to buy around 1.3550/1.2750 levels with protective stops at 1.1950 and targeting above 1.4200 at least. Also note that previous Wave 4 terminated at 1.2821, and a common co-relation suggests that Wave (2) might terminate near 1.2800. In either case, expect prices to drop at least below 1.2900 to complete the zigzag pattern, before Wave (3) resumes higher. It remains to be seen if GBPUSD could drop until 1.2550 or find support earlier. Watch out for a bullish reversal soon enough.
Prepared by
Harsh Japee, Technical Analyst.
GBPUSD Chart
MyFxtops 邁投 (www.myfxtops.com) -Reliable Forex Copy Trade community, follow the master for free to trade!
Disclaimer: This article is reproduced from the Internet. If there is any infringement, please contact us to delete it immediately. In addition: This article only represents the personal opinion of the author and has nothing to do with Mato Finance The originality and the text and content stated in this article have not been confirmed by this site. The authenticity, completeness and timeliness of this article and all or part of the content and text are not guaranteed or promised. Please refer to it for reference only Verify the content yourself.
Copyright belongs to the author.
For commercial reprints, please contact the author for authorization. For non-commercial reprints, please indicate the source.
MyFxtops迈投(www.myfxtops.com)-靠谱的外汇跟单社区,免费跟随高手做交易!
免责声明:本文系转载自网络,如有侵犯,请联系我们立即删除,另:本文仅代表作者个人观点,与迈投财经无关。其原创性以及文中陈述文字和内容未经本站证实,对本文以及其中全部或者部分内容、文字的真实性、完整性、及时性本站不作任何保证或承诺,请读者仅作参考,并请自行核实相关内容。
著作权归作者所有。
商业转载请联系作者获得授权,非商业转载请注明出处。


