
Bottom line: NZDUSD might have retraced to find major support around 61.8% fibonacci levels. The bullish structure should remain intact till prices stay above 0.6200.
Technical Analysis:
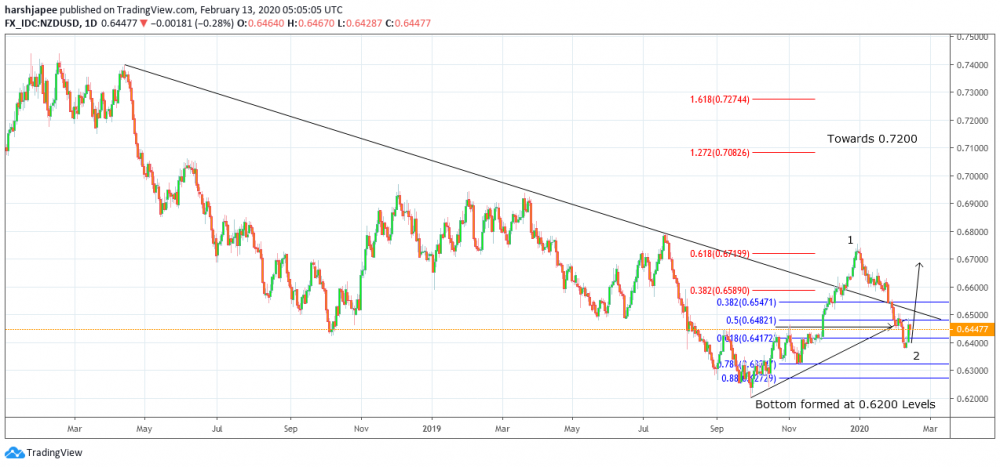
NZDUSD bulls might be looking to come back strong after printing 0.6378 lows this early this week. Please note that it has found support at the fibonacci 0.618 retracement of previous rally from 0.6200 through 0.6755 respectively. Continuing from what was discussed last week the wave counts have been corrected. The rally between 0.6200 and 0.6755 could be Wave 1 followed by a corrective drop A-B-C terminating at 0.6378 levels as Wave 2. Also note that a Morning Star candlestick pattern has completed on the daily chart, indicating a potential bullish reversal. Furthermore, the RSI (not shown here) has sharply risen through the 40 levels since 0.6378 lows earlier. All the above indicate that NZDUSD might have formed a potential bottom and could be ready for the next rally. Minimum projections for a potential Wave 3 target could be around 0.7100 levels. Most traders might be looking to consider longs around current price action (0.6440/50) with protective stops at 0.6200 and potential target above 0.7100 respectively. It should be noted that the corrective drop since 0.6755 has probably unfolded into a classic Zigzag pattern which is 5-3-5 at a higher degree. It was best probable to consider re-adjusting the counts for a potential Wave 1 and 2 respectively. If the above is correct, Wave 3 rally could be underway since 0.6378 levels and bulls are expected to remain in control from here. Immediate price resistance is seen at 0.6500 levels and a break higher would be much encouraging for bulls. Until NZDUSD stays above 0.6324 levels, the above bullish structure should remain intact. Watch out for a break above 0.6500 as short term potential targets.
Prepared by
Harsh Japee, Technical Analyst.
NZDUSD Chart
MyFxtops 邁投 (www.myfxtops.com) -Reliable Forex Copy Trade community, follow the master for free to trade!
Disclaimer: This article is reproduced from the Internet. If there is any infringement, please contact us to delete it immediately. In addition: This article only represents the personal opinion of the author and has nothing to do with Mato Finance The originality and the text and content stated in this article have not been confirmed by this site. The authenticity, completeness and timeliness of this article and all or part of the content and text are not guaranteed or promised. Please refer to it for reference only Verify the content yourself.
Copyright belongs to the author.
For commercial reprints, please contact the author for authorization. For non-commercial reprints, please indicate the source.
MyFxtops迈投(www.myfxtops.com)-靠谱的外汇跟单社区,免费跟随高手做交易!
免责声明:本文系转载自网络,如有侵犯,请联系我们立即删除,另:本文仅代表作者个人观点,与迈投财经无关。其原创性以及文中陈述文字和内容未经本站证实,对本文以及其中全部或者部分内容、文字的真实性、完整性、及时性本站不作任何保证或承诺,请读者仅作参考,并请自行核实相关内容。
著作权归作者所有。
商业转载请联系作者获得授权,非商业转载请注明出处。


