
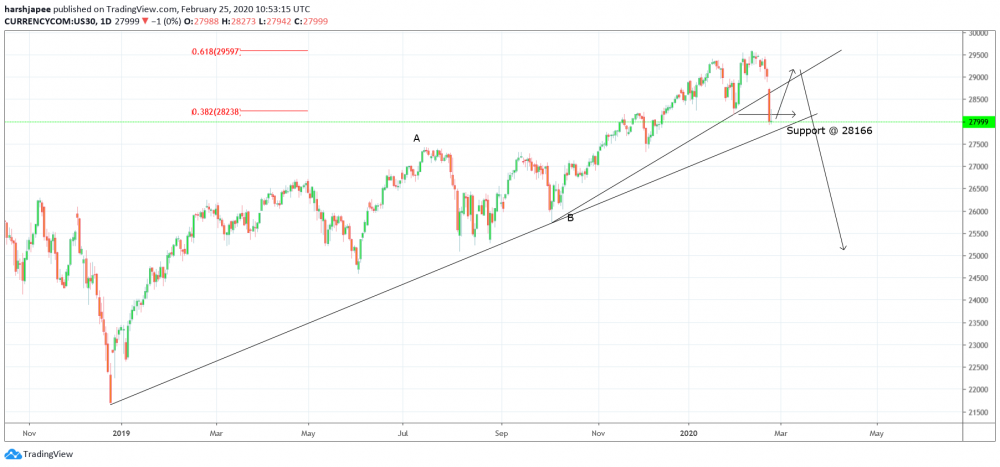
Bottom line: Dow Jones bearish structure is now expected to remain intact until prices stay below 29587 levels. Expect a pullback rally towards 29000 levels before resuming lower again.
Technical Analysis:
Dow Jones finally reversed sharply from sub 29500 levels last week, as we have been bringing up and discussing since last several weeks. The structure looks to be now complete with a meaningful high in place at 29587 levels. Please also note that initial support at 28166 has also been taken out as bears register themselves to push further from here. The drop from 29587 through sub 28000 seems to be an impulse, and could be labelled as Wave 1 or A of a much larger correction lower. If the above is correct, please be prepared for a Wave 2 termination higher from here towards the 29000 region, before Dow Jones resumes lower again. Also note that backside of the immediate line of support is seen through sub 29000 levels, which could act as resistance for any counter trend rallies. Most traders who initiated aggressive shorts from 29000/500 levels might be willing to take profits around current price action and remain flat as the counter trend rally unfolds. An aggressive trader might be looking to initiate longs with stop lost at 27800, and projected target towards 29000 respectively. Looking at the larger degree wave counts, Dow Jones might have terminated an A-B-C rally that had begun since 21685 lows in December 2018. Wave B was a triangle structure and Wave C finally might have terminated at 29587 levels. If the above holds true, Dow Jones is expected to stay below 29587 levels going forward and continue dropping lower towards 21000 levels in the long term. Alternately the recent drop could be an expanded flat lower degree wave iv within Wave C. In that case, we should witness another high above 29587 before a bearish reversal.
Prepared by
Harsh Japee, Technical Analyst.
Dow Jones Chart
MyFxtops 邁投 (www.myfxtops.com) -Reliable Forex Copy Trade community, follow the master for free to trade!
Disclaimer: This article is reproduced from the Internet. If there is any infringement, please contact us to delete it immediately. In addition: This article only represents the personal opinion of the author and has nothing to do with Mato Finance The originality and the text and content stated in this article have not been confirmed by this site. The authenticity, completeness and timeliness of this article and all or part of the content and text are not guaranteed or promised. Please refer to it for reference only Verify the content yourself.
Copyright belongs to the author.
For commercial reprints, please contact the author for authorization. For non-commercial reprints, please indicate the source.
MyFxtops迈投(www.myfxtops.com)-靠谱的外汇跟单社区,免费跟随高手做交易!
免责声明:本文系转载自网络,如有侵犯,请联系我们立即删除,另:本文仅代表作者个人观点,与迈投财经无关。其原创性以及文中陈述文字和内容未经本站证实,对本文以及其中全部或者部分内容、文字的真实性、完整性、及时性本站不作任何保证或承诺,请读者仅作参考,并请自行核实相关内容。
著作权归作者所有。
商业转载请联系作者获得授权,非商业转载请注明出处。


