
Bottom line: NZDUSD might have carved a potential bottom around 0.5470 levels but still need to clear past 0.6400 resistance. This would confirm medium term trend reversal.
Technical Analysis:
NZDUSD has dropped significantly during the past few trading sessions. After printing lows at 0.5470 on March 16, 2020 the single currency pair is gradually building momentum on the north side.
NZDUSD bulls still need to clear immediate resistance, the March 09 high at 0.6447 levels to confirm that medium term trend has changed.
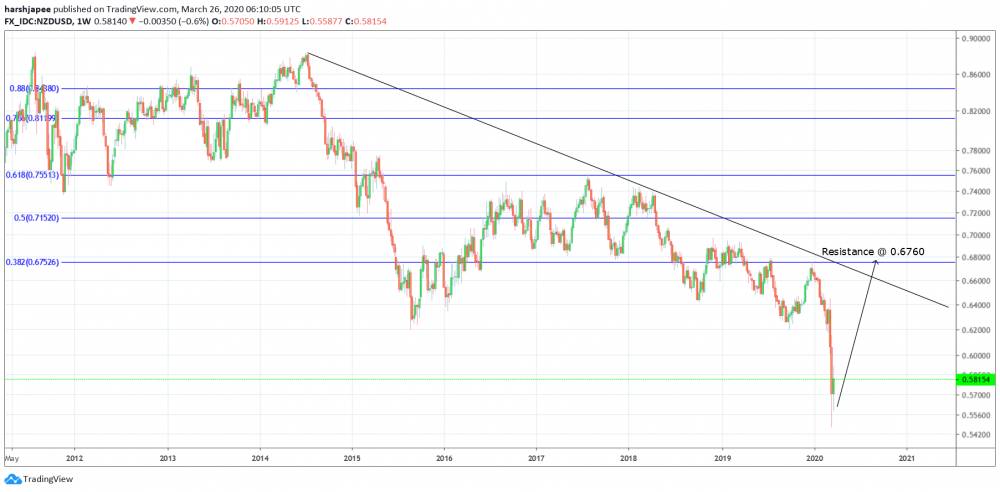
A weekly chart view has been presented here for understanding the larger wave structure. It is clear that NZDUSD has been dropping since July 2011, after printing highs at 0.8842 levels. Unlike the Aussie Dollar, NZDUSD is still holding above its 2008/09 support at 0.4895 levels. The drop from 0.8842 has found potential support at 0.5470, which is fibonacci 0.786 support of the previous rally between 0.4985 and 0.8842 respectively. If bulls manage to hold above 0.5470 levels, a significant rally could be seen towards 0.7550 levels in the coming months.
A conservative trading strategy from here might be to remain flat and allow price action to break above resistance at 0.6447/0.6700 levels. Most traders might prepare to long on dips after the resistance is broken. Alternatively, if interim support at 0.5470 breaks, NZDUSD may further push towards 0.4895, the 2008/09 support levels.
Looking at the lower time frame (1 hour), NZDUSD bulls seems to have managed to produce Wave 1 between 0.5470 through 0.5917 levels. If this rally continues from here NZDUSD bulls would be poised to break above 0.6400/50 levels. This would be considered to be constructive for further upside.
Overall, NZDUSD might be very close to have formed a significant bottom around 0.5470 levels and a break above 0.6447 would confirm. But if 0.5470 breaks, it could extend the drop to 0.4895 levels, the 2008/09 support. Most traders might be preparing to initiate fresh long positions on dips thereafter.
Prepared by
Harsh Japee, Technical Analyst.
NZDUSD Chart
MyFxtops 邁投 (www.myfxtops.com) -Reliable Forex Copy Trade community, follow the master for free to trade!
Disclaimer: This article is reproduced from the Internet. If there is any infringement, please contact us to delete it immediately. In addition: This article only represents the personal opinion of the author and has nothing to do with Mato Finance The originality and the text and content stated in this article have not been confirmed by this site. The authenticity, completeness and timeliness of this article and all or part of the content and text are not guaranteed or promised. Please refer to it for reference only Verify the content yourself.
Copyright belongs to the author.
For commercial reprints, please contact the author for authorization. For non-commercial reprints, please indicate the source.
MyFxtops迈投(www.myfxtops.com)-靠谱的外汇跟单社区,免费跟随高手做交易!
免责声明:本文系转载自网络,如有侵犯,请联系我们立即删除,另:本文仅代表作者个人观点,与迈投财经无关。其原创性以及文中陈述文字和内容未经本站证实,对本文以及其中全部或者部分内容、文字的真实性、完整性、及时性本站不作任何保证或承诺,请读者仅作参考,并请自行核实相关内容。
著作权归作者所有。
商业转载请联系作者获得授权,非商业转载请注明出处。


