
Bottom line: Ethereum remains bullish until prices hold above 83.67 levels, the December 2018 lows. A complex corrective structure might have terminated around 90.00 levels as bulls remain poised to print higher highs and higher lows, going forward.
Technical Analysis:
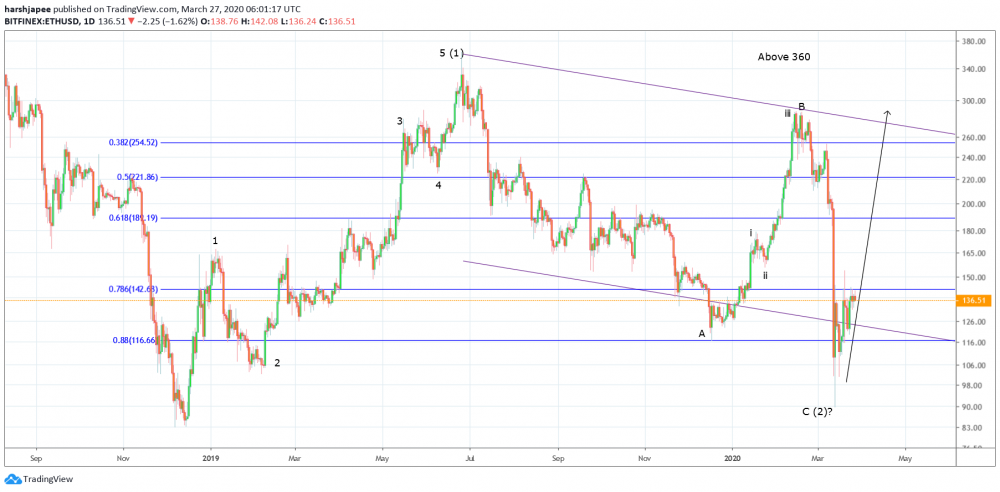
Ethereum seems to be in control of bulls since printing lows around 90.00 levels on March 13, 2020. The subsequent rally towards 155.00 levels does not confirm a reversal in trend, but potential remains. The line in sand for bulls to remain in control is that prices must stay above 83.67 interim support.
The overall wave structure since December 2018 could be constructed as follows. Ethereum had rallied between 83.67 and 363.30 levels in 5 waves (impulse). The corrective drop since 363.30 through 90.00 levels might have taken a complex combination to complete. Also note that the drop has found support around the fibonacci 0.88 percent retracement of the previous rally. A bullish reversal here would keep the overall structure intact and Ethereum could print higher lows and higher highs.
Most traders might be willing to initiate fresh long positions around 116.00/117.00 levels, with a protective stop below 89.00 and projected targets 280 in the short term. Alternately, if prices break below the 89.00 mark, it would confirm a re-test at 83.67 levels going forward.
Overall, Ethereum bulls are expected to remain in control until prices stay broadly above 83.67 levels going forward. A break below would delay matters further and Ethereum could drop up to 60.00 levels before finding support again.
Immediate resistance is seen around 252.00 mark, the March 07 2020 high. If Ethereum bulls manage to break above 252.00 resistance, it would confirm that a meaningful bottom is in place around 90.00 and trend has changed to bullish. It remains to be seen if price action holds above 90.00 levels going forward.
Prepared by
Harsh Japee, Technical Analyst.
Ethereum Chart
MyFxtops 邁投 (www.myfxtops.com) -Reliable Forex Copy Trade community, follow the master for free to trade!
Disclaimer: This article is reproduced from the Internet. If there is any infringement, please contact us to delete it immediately. In addition: This article only represents the personal opinion of the author and has nothing to do with Mato Finance The originality and the text and content stated in this article have not been confirmed by this site. The authenticity, completeness and timeliness of this article and all or part of the content and text are not guaranteed or promised. Please refer to it for reference only Verify the content yourself.
Copyright belongs to the author.
For commercial reprints, please contact the author for authorization. For non-commercial reprints, please indicate the source.
MyFxtops迈投(www.myfxtops.com)-靠谱的外汇跟单社区,免费跟随高手做交易!
免责声明:本文系转载自网络,如有侵犯,请联系我们立即删除,另:本文仅代表作者个人观点,与迈投财经无关。其原创性以及文中陈述文字和内容未经本站证实,对本文以及其中全部或者部分内容、文字的真实性、完整性、及时性本站不作任何保证或承诺,请读者仅作参考,并请自行核实相关内容。
著作权归作者所有。
商业转载请联系作者获得授权,非商业转载请注明出处。


