
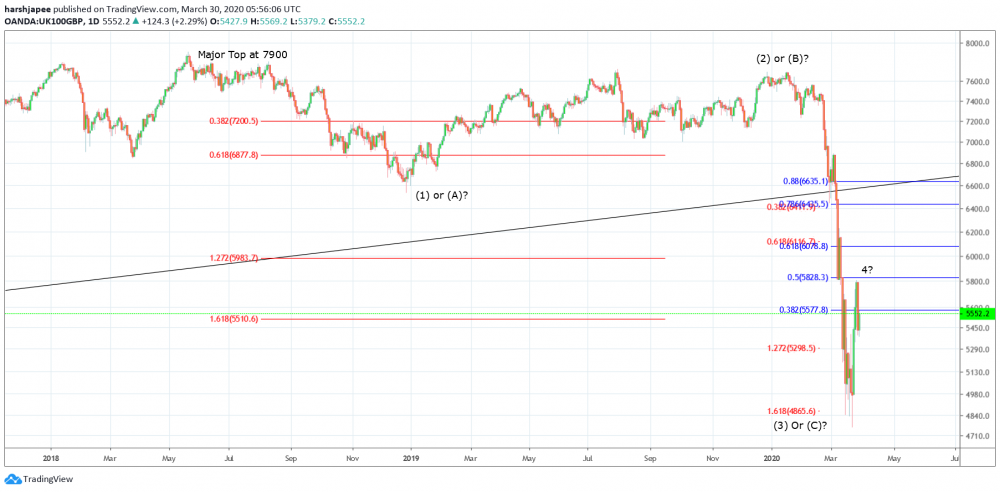
Bottom line: FTSE bearish structure remains intact until prices stay below 6550/6600, the past support turned resistance. Furthermore, the counter trend rally might have hit interim resistance around 5800 mark.
Technical Analysis:
FTSE might have completed its counter trend rally over the last week after having hit 5800 levels. A bearish turn here might resume towards fresh lows below the 4760 levels, going forward. It remains to be seen if the counter trend rally could extend further or resume lower from current levels.
The overall drop since 7904 highs in May 2018 and 4800 lows in March 2020, has completed 3 waves until now. If the drop is complete, FTSE is expected to hold above 4760 levels going forward. Looking at global indices, it seems unlikely that the drop is yet complete and hence most traders might be willing to initiate fresh short positions at higher levels.
The recent rally has stalled at the fibonacci 50% retracement of the recent drop between 6888 and 4762 respectively. Also an engulfing bearish candlestick pattern can be seen on the daily chart, indicating a potential reversal ahead. If the above holds true, bears might remain poised to resume lower from here and print below 4760 levels, going forward.
If an impulse drop (5 waves) is under way since the 7904 highs in May 2018, FTSE would remain capped below the 6500/6600 levels. In that case, most traders might be willing to initiate fresh short positions close to 5500/5600, with protective stops at 6600 and projected targets well below 4700 mark, respectively.
Alternately, the counter trend may extend higher towards backside of the support trend line which is passing around 6700 levels at this point in writing. Please note the above zone is past support turned resistance and converging with fibonacci 0.618 retracement of the drop between 7700 and 4760 respectively. Bearish bounce remains a high probability there.
Prepared by
Harsh Japee, Technical Analyst.
FTSE Chart
MyFxtops 邁投 (www.myfxtops.com) -Reliable Forex Copy Trade community, follow the master for free to trade!
Disclaimer: This article is reproduced from the Internet. If there is any infringement, please contact us to delete it immediately. In addition: This article only represents the personal opinion of the author and has nothing to do with Mato Finance The originality and the text and content stated in this article have not been confirmed by this site. The authenticity, completeness and timeliness of this article and all or part of the content and text are not guaranteed or promised. Please refer to it for reference only Verify the content yourself.
Copyright belongs to the author.
For commercial reprints, please contact the author for authorization. For non-commercial reprints, please indicate the source.
MyFxtops迈投(www.myfxtops.com)-靠谱的外汇跟单社区,免费跟随高手做交易!
免责声明:本文系转载自网络,如有侵犯,请联系我们立即删除,另:本文仅代表作者个人观点,与迈投财经无关。其原创性以及文中陈述文字和内容未经本站证实,对本文以及其中全部或者部分内容、文字的真实性、完整性、及时性本站不作任何保证或承诺,请读者仅作参考,并请自行核实相关内容。
著作权归作者所有。
商业转载请联系作者获得授权,非商业转载请注明出处。


