
Bottom line: Gold breaks above marked resistance at $1703 and hits $1725 before pulling back. A break below $1640 would be minimum requirement to confirm a top in place.
Fundamental Outlook:
Gold prices surge to new yearly highs as the metal hits $1725 on Monday. The US Dollar has been under pressure with Fed announcing $2.3 trillion in loans to help businesses. This in turn might have added to the recent surge in Gold prices. The yellow metal is seen to be trading around $1714 at this point in writing and potential remains to test $1730/50.
Oil prices still remain under pressure and closed around 3.5% lower yesterday at 22.36. The fundamental effects over the OPEC meet and the end to price war between Russia and Saudi Arabia are yet to be seen. A production cut of over 10 million barrels per day was agreed upon last week. Oil trades around 22.50 at this point in writing and might drop to 21.30 before support comes in.
Most Global Indices have risen over 20% since their respective March lows as Central Banks have collectively made efforts to boost sentiment. However, the decline in major indices might be far from over as countries face extended lockdown due to COVID-19 pandemic.
Technical Analysis:
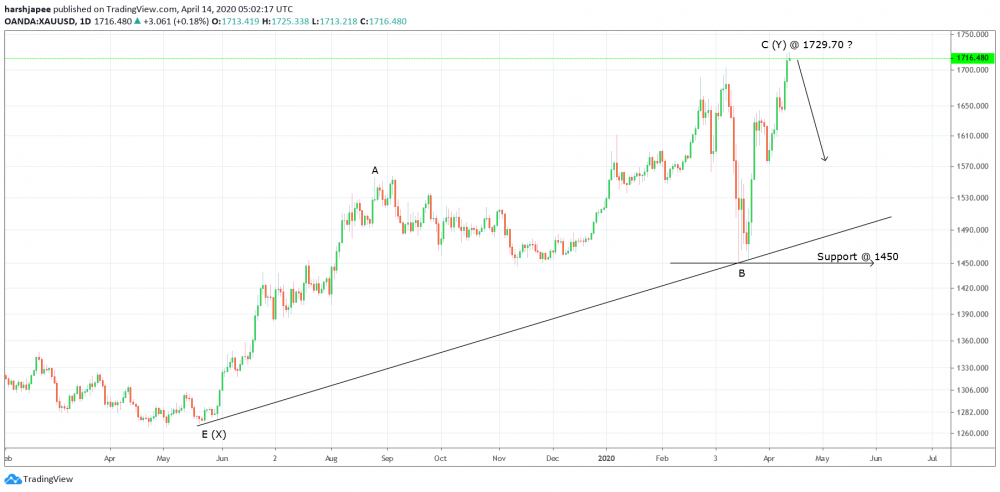
Gold seems to be under absolute control of bulls after pushing through resistance at $1703 and printing fresh yearly highs at $1725. Technically, the recent price surge could be seen as a bull trap as traders rush to buy Gold.
We have been calling for a swift decline in Gold price since last several weeks and today is no different as Gold hits fibonacci 0.786 retracement of the entire drop between $1920 and $1046. Please pay attention to the larger picture discussed earlier, to avoid getting on the wrong side of trade.
Upside potential remains limited to $1730/50 zone and most traders might be surprised to see a bearish reversal soon. This could last for the next several weeks and months.
Prepared by
Harsh Japee, Technical Analyst.
Gold Chart
MyFxtops 邁投 (www.myfxtops.com) -Reliable Forex Copy Trade community, follow the master for free to trade!
Disclaimer: This article is reproduced from the Internet. If there is any infringement, please contact us to delete it immediately. In addition: This article only represents the personal opinion of the author and has nothing to do with Mato Finance The originality and the text and content stated in this article have not been confirmed by this site. The authenticity, completeness and timeliness of this article and all or part of the content and text are not guaranteed or promised. Please refer to it for reference only Verify the content yourself.
Copyright belongs to the author.
For commercial reprints, please contact the author for authorization. For non-commercial reprints, please indicate the source.
MyFxtops迈投(www.myfxtops.com)-靠谱的外汇跟单社区,免费跟随高手做交易!
免责声明:本文系转载自网络,如有侵犯,请联系我们立即删除,另:本文仅代表作者个人观点,与迈投财经无关。其原创性以及文中陈述文字和内容未经本站证实,对本文以及其中全部或者部分内容、文字的真实性、完整性、及时性本站不作任何保证或承诺,请读者仅作参考,并请自行核实相关内容。
著作权归作者所有。
商业转载请联系作者获得授权,非商业转载请注明出处。


