
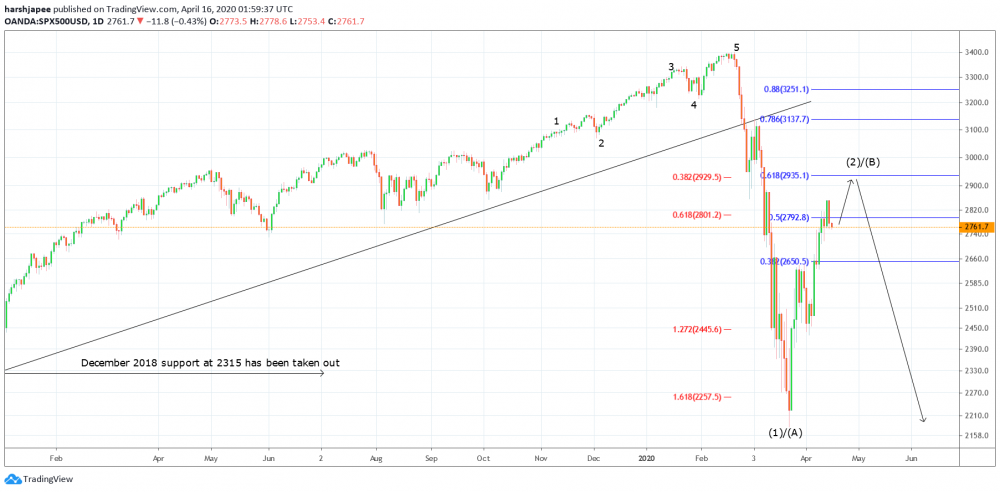
Bottom line: SPX500 long term bearish structure remains intact until prices broadly stay below 3400 mark. The counter trend rally that began from 2180 levels since March 23, 2020 could be close to terminating around 2850/2930 levels.
Fundamental Outlook:
The SPX500 slid by over 2.5% yesterday closing at 2773 levels. The drop has been backed by earning reports suggesting loan defaults to rise alarmingly. The indice could be at risk to resume its slide as IMF economic report for 2020 suggests decline in Global GDP by 3%. The earning season would add further pressure.
Oil prices continue to slide lower as WTI Crude dropped below $19.25 though marginally. Despite the production cut agreed by the OPEC members and a truce between Russia and Saudi Arabia, the slide continues.
Today’s events:
Bank of England Liabilities/Credits Survey @ 04:30 AM EST
Initial US Jobless Claims @ 08:30 AM EST
Technical Analysis:
SPX500 counter trend rally might be soon approaching strong resistance around 2930 levels. Please note that 2930 is marked by fibonacci 0.618 retracement of the entire drop between 3400 and 2180 respectively. Hence, probabilities of a bearish reversal remains high if prices manage to reach 2900/30 zone.
SPX500 has hit the fibonacci 0.50 retracement around 2850 and reversed lower. An engulfing bearish candlestick pattern has produced on the daily chart, indicating potential reversal ahead. Let us be prepared for a reversal from here or 2900/30 levels, going forward.
Initial drop from 3400 to 2180 was an impulse indicting the correction is yet incomplete. The recent rally towards 2850 is nothing but a correction and it is just a matter of time, SPX500 resumes its journey lower again.
Most traders might be willing to initiate fresh short positions around 2850/2930 with a protective stop above 3400 and projected targets below 1500 mark.
Prepared by
Harsh Japee, Technical Analyst.
SPX500 Chart
MyFxtops 邁投 (www.myfxtops.com) -Reliable Forex Copy Trade community, follow the master for free to trade!
Disclaimer: This article is reproduced from the Internet. If there is any infringement, please contact us to delete it immediately. In addition: This article only represents the personal opinion of the author and has nothing to do with Mato Finance The originality and the text and content stated in this article have not been confirmed by this site. The authenticity, completeness and timeliness of this article and all or part of the content and text are not guaranteed or promised. Please refer to it for reference only Verify the content yourself.
Copyright belongs to the author.
For commercial reprints, please contact the author for authorization. For non-commercial reprints, please indicate the source.
MyFxtops迈投(www.myfxtops.com)-靠谱的外汇跟单社区,免费跟随高手做交易!
免责声明:本文系转载自网络,如有侵犯,请联系我们立即删除,另:本文仅代表作者个人观点,与迈投财经无关。其原创性以及文中陈述文字和内容未经本站证实,对本文以及其中全部或者部分内容、文字的真实性、完整性、及时性本站不作任何保证或承诺,请读者仅作参考,并请自行核实相关内容。
著作权归作者所有。
商业转载请联系作者获得授权,非商业转载请注明出处。


