
Bottom line: Dow Jones long term bearish structure remains intact until prices stay below 29600 levels. The recent counter trend rally that had begun from 18200 levels might have terminated around 24400 levels. A push through 25300 will face stiff resistance.
Fundamental Outlook:
Dow Jones along with SPX500 and NASDAQ had slipped by over 2% yesterday and closed just around 23000 mark. The historic drop in Oil prices on Monday had fueled the slide in indices globally. Meanwhile, another stimulus of over $484 billion has been announced by Fed yesterday. It remains to be seen if this could help boost investor/trader sentiment. Dow is seen trading around 23170 at this point and a push above 24400 could test 25300.
Oil prices continue to slide with Brent Crude dropping over 24% yesterday and closing below $20/barrel. The unscheduled OPEC+ meeting held yesterday remained inconclusive of further measures, as U.S remains committed to check further slide. Brent trades 16.00% lower at this point around $16.54/barrel.
Technical Analysis:
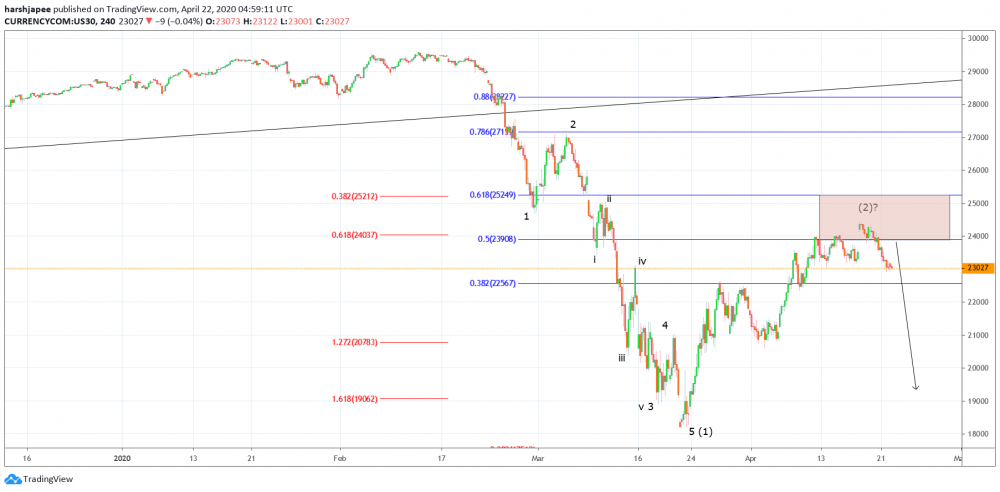
Dow Jones bulls are facing resistance around the 24500 zone. The indice reversed yesterday to find an interim support around 22900 levels. It is quite probable that Dow Jones might have topped around 24400 levels or it could be very close to topping around 25300 in near term.
Overall structure remains bearish after Dow Jones had dropped between 29600 through 18200 during Feb-Mar 2020. Since then, the counter trend rally has been impressive and managed to reach just over fibonacci 0.50 retracement of previous drop.
A fibonacci convergence is seen around the 25300 levels where the 61.8% retracement meets 61.8% extension of the counter trend rally. If bulls manage to push higher towards the above mark, Dow Jones would face strong resistance and produce a sharp bearish reversal.
Traders might remain poised to sell on rallies through 24000/25300 mark, with stops above 27200 resistance, going forward.
Prepared by
Harsh Japee, Technical Analyst.
Dow Jones Chart
MyFxtops 邁投 (www.myfxtops.com) -Reliable Forex Copy Trade community, follow the master for free to trade!
Disclaimer: This article is reproduced from the Internet. If there is any infringement, please contact us to delete it immediately. In addition: This article only represents the personal opinion of the author and has nothing to do with Mato Finance The originality and the text and content stated in this article have not been confirmed by this site. The authenticity, completeness and timeliness of this article and all or part of the content and text are not guaranteed or promised. Please refer to it for reference only Verify the content yourself.
Copyright belongs to the author.
For commercial reprints, please contact the author for authorization. For non-commercial reprints, please indicate the source.
MyFxtops迈投(www.myfxtops.com)-靠谱的外汇跟单社区,免费跟随高手做交易!
免责声明:本文系转载自网络,如有侵犯,请联系我们立即删除,另:本文仅代表作者个人观点,与迈投财经无关。其原创性以及文中陈述文字和内容未经本站证实,对本文以及其中全部或者部分内容、文字的真实性、完整性、及时性本站不作任何保证或承诺,请读者仅作参考,并请自行核实相关内容。
著作权归作者所有。
商业转载请联系作者获得授权,非商业转载请注明出处。


