
Bottom line: SPX500 remain bearish against 3400 levels, in the long term. The counter trend rally is soon approaching major resistance around 2900 levels and bears are expected to take control back.
Fundamental Outlook:
The SPX500 alongside Dow Jones managed to close higher by over 2% yesterday. Optimism over another $484 billion stimulus talks by Fed and Netflix earnings, showed up on the indices as they opened gap up. As we stare at a Global Recession that could be worst since the Great Depression of 1930s, it is not difficult to gauge another round of selloff inching closer though.
US Dollar gained as EURUSD sold off just ahead of the EU Summit yesterday. There is pessimism over EU leaders coming to an agreement on a $2.2 trillion plan, which helped the US Dollar gain against major currencies, despite a rally in SPX500 and Dow Jones.
Oil prices closed in the green yesterday with Brent over 5% and WTI close to 10%. It is too early to confirm but Oil prices could be well past their multi-year lows respectively. Oil trades above 7% while we write this article and may continue higher as the day progresses.
Technical Analysis:
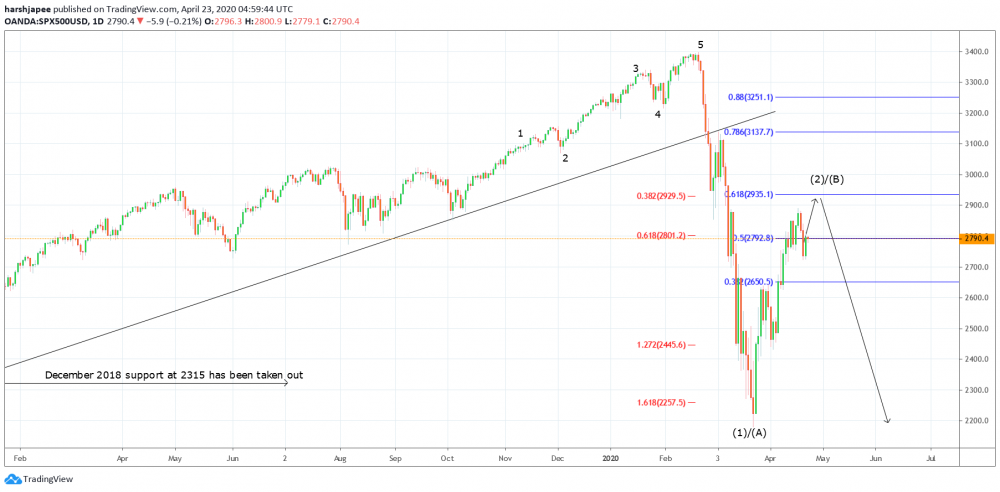
SPX500 remains vulnerable for yet another round of sell off from 2900 levels. Believe it or not, the rally since 2180 lows is just a counter trend or corrective. The indice has gained by 35% in the last one month but it is no means to measure a trend reversal. It is trading around 2805 levels while we are writing and could reach 2900 before reversing lower again.
SPX500 would hit fibonacci 0.618 retracement of the entire drop between 3400 and 2180 if 2900 is reached. Probability for a bearish reversal is high around 2900/2920 as it is the past support turned resistance zone.
Traders might be preparing to sell between 2900 and 2920 levels, with protective stops above 3200 or 3400 and projected targets below 2200 respectively.
Prepared by
Harsh Japee, Technical Analyst.
SPX500 Chart
MyFxtops 邁投 (www.myfxtops.com) -Reliable Forex Copy Trade community, follow the master for free to trade!
Disclaimer: This article is reproduced from the Internet. If there is any infringement, please contact us to delete it immediately. In addition: This article only represents the personal opinion of the author and has nothing to do with Mato Finance The originality and the text and content stated in this article have not been confirmed by this site. The authenticity, completeness and timeliness of this article and all or part of the content and text are not guaranteed or promised. Please refer to it for reference only Verify the content yourself.
Copyright belongs to the author.
For commercial reprints, please contact the author for authorization. For non-commercial reprints, please indicate the source.
MyFxtops迈投(www.myfxtops.com)-靠谱的外汇跟单社区,免费跟随高手做交易!
免责声明:本文系转载自网络,如有侵犯,请联系我们立即删除,另:本文仅代表作者个人观点,与迈投财经无关。其原创性以及文中陈述文字和内容未经本站证实,对本文以及其中全部或者部分内容、文字的真实性、完整性、及时性本站不作任何保证或承诺,请读者仅作参考,并请自行核实相关内容。
著作权归作者所有。
商业转载请联系作者获得授权,非商业转载请注明出处。


