
Bottom line: Dow Jones long term bearish structure remains intact until prices hold below 29600, going forward. A push through 25200/300 levels would be considered ideal for a resumption of down trend. It is only a matter of time before bears are back in control.
Fundamental Outlook:
Dow Jones had closed lower by over -2.00% yesterday along with its peers SPX500 (-2.75%) and NASDAQ (-2.5%). The drop doesn’t come as a surprise as markets cannot ignore a looming recession in 2020. Also, as US and Europe re-open post lock down, fears of a possible re-surge in COVID-19 cases remain. It would be interesting to see how UK and European markets open today after the overnight turn in risk assets. Watch out for the UK GDP figures today around 02:00 AM EST, expected to print -7.2%, YoY.
AUDUSD ticked lower yesterday, following sentiment in the US Stock Markets. The growth linked currency pair is trading around 0.6477/79 as we write the article and could come under further pressure if risk aversion continues and markets decline further.
Bitcoin halving on May 11, 2020 turned out to be a Non-Event with respect to price action. Bullish sentiment prevails in the crypto but a 10-15% drop cannot be ruled out yet. Bitcoin trades around 8900 levels as we write this article and could drop towards 7200/500 levels. This had happened during prior Bitcoin halving as well.
Technical Analysis:
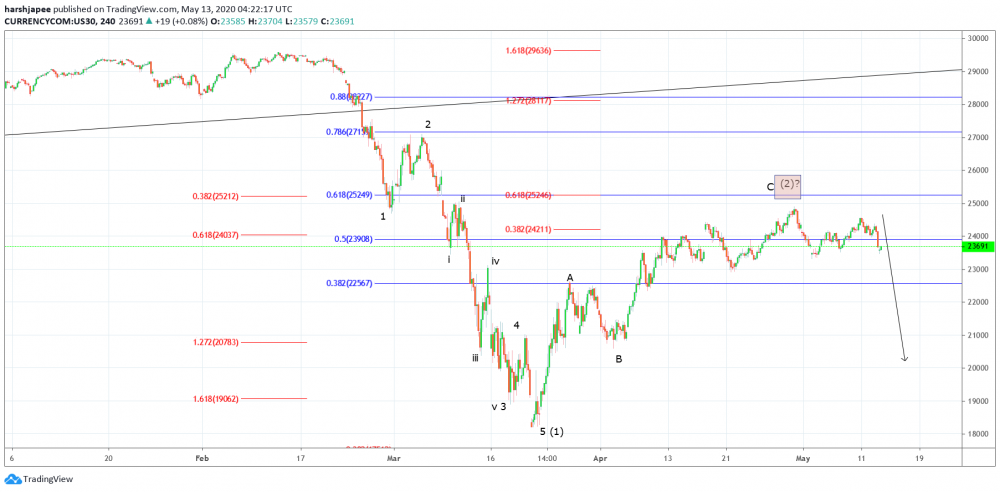
Dow Jones remains vulnerable for another round of selloff as prices reverse sharply from 24382 levels yesterday. The indice found interim support around 23450 mark and it remains to be seen if bears resume lower again.
Dow Jones had earlier dropped from 29600 through 18200 levels, sub dividing into 5 waves (impulse drop). An impulse wave confirms that the drop is incomplete and at least one more low below 18200 is required.
The subsequent counter trend rally also seems to be complete at 24897 levels on April 30, 2020 OR could print yet another high towards 25200 before. Please note that fibonacci 0.618 retracement of earlier drop is also seen towards 25200 levels and hence a bearish reaction remains a high probability.
Traders might consider to remain short and also add further if Dow Jones manages to reach 25200 resistance zone. Protective stops might be placed above 27300 mark and projected targets below 18200 mark.
Prepared by
Harsh Japee, Technical Analyst.
Dow Jones Chart
MyFxtops 邁投 (www.myfxtops.com) -Reliable Forex Copy Trade community, follow the master for free to trade!
Disclaimer: This article is reproduced from the Internet. If there is any infringement, please contact us to delete it immediately. In addition: This article only represents the personal opinion of the author and has nothing to do with Mato Finance The originality and the text and content stated in this article have not been confirmed by this site. The authenticity, completeness and timeliness of this article and all or part of the content and text are not guaranteed or promised. Please refer to it for reference only Verify the content yourself.
Copyright belongs to the author.
For commercial reprints, please contact the author for authorization. For non-commercial reprints, please indicate the source.
MyFxtops迈投(www.myfxtops.com)-靠谱的外汇跟单社区,免费跟随高手做交易!
免责声明:本文系转载自网络,如有侵犯,请联系我们立即删除,另:本文仅代表作者个人观点,与迈投财经无关。其原创性以及文中陈述文字和内容未经本站证实,对本文以及其中全部或者部分内容、文字的真实性、完整性、及时性本站不作任何保证或承诺,请读者仅作参考,并请自行核实相关内容。
著作权归作者所有。
商业转载请联系作者获得授权,非商业转载请注明出处。


