
World markets are providing the feel that they are trying not to give a slip on a banana skin moment as the warning signs to investors come in thick and thin that the recoveries in world markets since the February lows are challenging to justify.
It has frequently been highlighted that the recovery in risk has been largely assisted by central bank easing policies and easier accessibility to money through government initiatives and the warning from Federal Reserve Chair Jerome Powell just yesterday that the current pandemic raises concerns about long-term economic damage with significant downside risks to the outlook has further highlighted anxiety.
Now, if another period of risk aversion does hit us (if) then the likelihood is that safe havens will be in demand once again. This potentially sounds promising for those who hold USD, JPY or Gold in their portfolio. Of course and as it is often remembered, in USDJPY a period of market uncertainty generally indicates a weaker USDJPY.
For what it is worth, I hold some doubt over how long this risk aversion will last as the market remains erratic overall but in the event that USDJPY does point further lower, 106.50 and 105.90 could become points of interest.
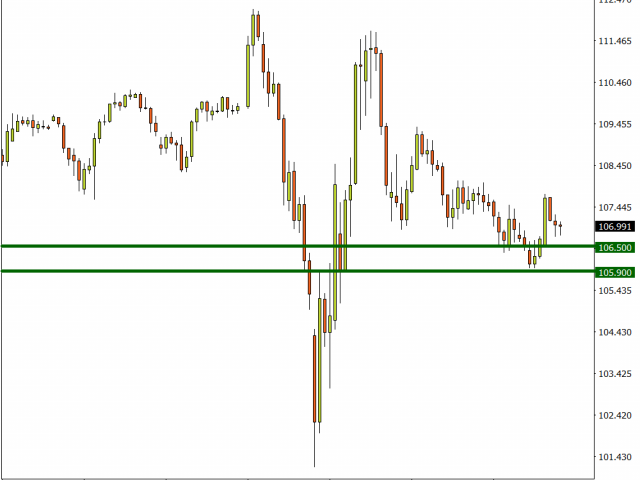
(USDJPY Daily FXTM MT4)
The Nasdaq presents a more interesting picture on the Daily timeframe of an asset that is perhaps starting a trend lower, however it is also important to note that this index consists of many major corporations from the technology sector that have shown in recent times that they can perform strongly in times of a crisis. Such as Netflix and Amazon.
However, if the Nasdaq does continue to point lower then the Daily low last seen on May 5, May 4 and April 22 could be looked at as potential areas of support.
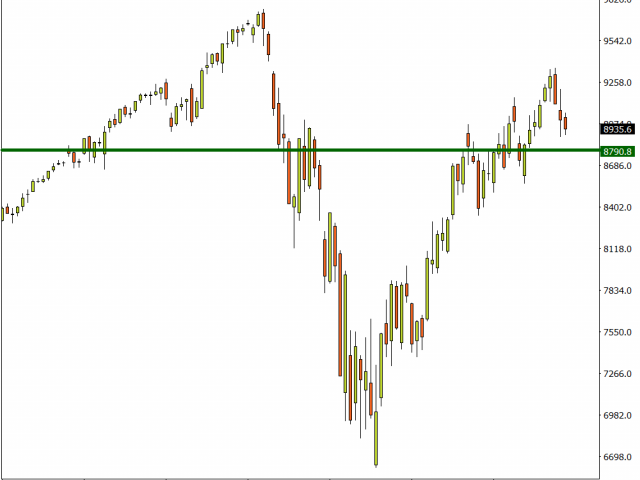
(Nasdaq Daily FXTM MT4)
The Daily chart on the S&P 500 highlights that 2710 and 2630 are potential support levels that the index could look for should the S&P hypothetically turn further lower.
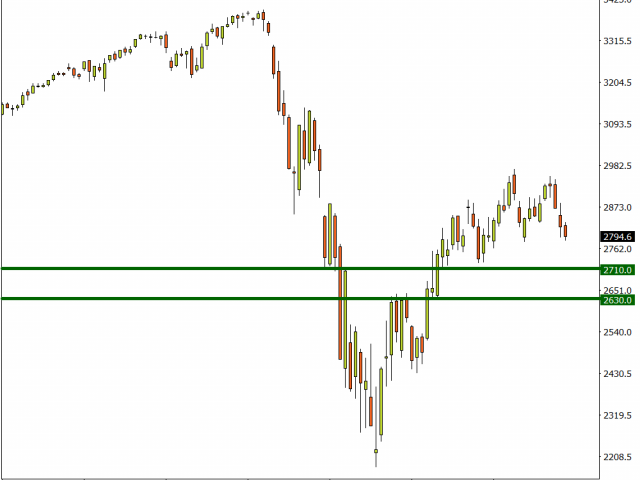
(S&P 500 Daily FXTM MT4)
For the Wall Street 30 Mini on the H4 charts a decline below 2283 could indicate further potential price weakness towards 2260 or 2245.
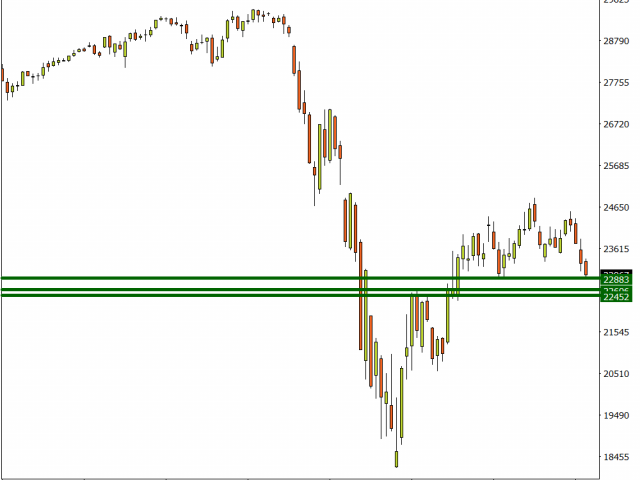
(Wall Street 30 Mini Daily FXTM MT4)
MyFxtops 邁投 (www.myfxtops.com) -Reliable Forex Copy Trade community, follow the master for free to trade!
Disclaimer: This article is reproduced from the Internet. If there is any infringement, please contact us to delete it immediately. In addition: This article only represents the personal opinion of the author and has nothing to do with Mato Finance The originality and the text and content stated in this article have not been confirmed by this site. The authenticity, completeness and timeliness of this article and all or part of the content and text are not guaranteed or promised. Please refer to it for reference only Verify the content yourself.
Copyright belongs to the author.
For commercial reprints, please contact the author for authorization. For non-commercial reprints, please indicate the source.


