
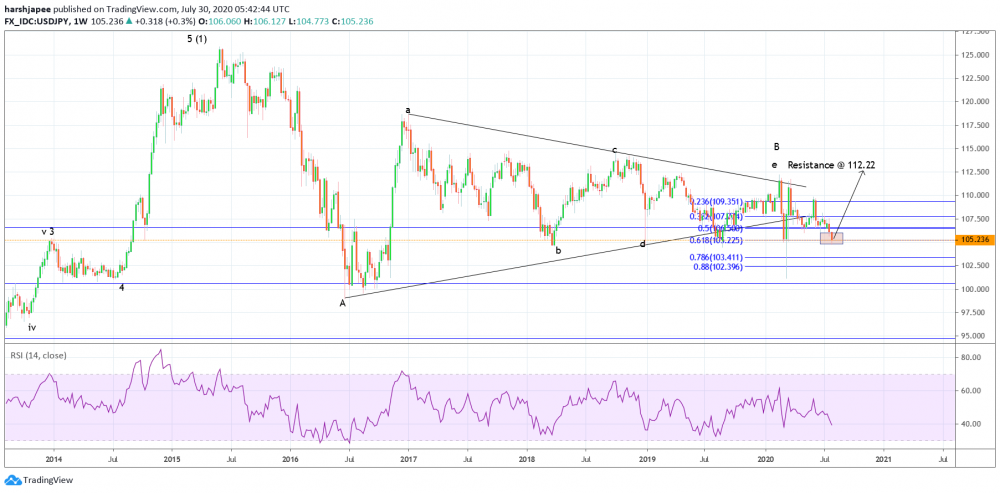
Bottom line: USDJPY long term structure remains bearish until prices stay below 112.22 resistance. The currency might have reached potential support zone around 105.00 levels and might produce a bullish reversal here. Traders might remain watchful now.
Fundamental Outlook:
NZDUSD had managed to reach 0.6700/05 this week before reversing lower again. The pro-risk currency exchange rate might be coming under pressure over trade developments with China in recent times. Furthermore, as Global Markets remain vulnerable for a drop most risk assets and currency pairs might come under pressure. The exchange rate trades lower around 0.6635 for now.
USDJPY exchange rate has remained lower since the past few trading sessions, touching 104.80 mark post FOMC yesterday. US Dollar has been on the receiving end against EURO, Japanese Yen and Pound Sterling among others recently. The exchange rate trades above 105.20 as we prepare to publish.
SPX500 closed around 3264 yesterday, higher by +1.34%. The Dow Jones and NASDAQ also managed to close higher by +0.70% and +1.4% respectively. With the FOMC behind us markets might take cues from the Q2 GDP figures and the decision on extending US unemployment benefits, as it expires tomorrow.
Technical Analysis:
USDJPY continued its down journey yesterday and dropped to 104.77 before pulling back. The larger trend continues to remain bearish but traders might remain vigilant over the short term as 105.00 remains potential support zone.
USDJPY had rallied from 101.00 through 111.75 during March 2020. Since then the currency has remained in control of bears and dropped all the way through 104.77 yesterday. Please note that fibonacci 0.618 retracement of the above rally is seen around 105.00 mark.
USDJPY bullish bounce from current levels remains a high probability. Immediate short term resistance is seen through 105.80 mark and a break above that might indicate that a meaningful bottom is in place around 104.77. Traders might book profits on the short positions taken earlier and be watchful.
Prepared by
Harsh Japee, Technical Analyst.
USDJPY Chart
MyFxtops 邁投 (www.myfxtops.com) -Reliable Forex Copy Trade community, follow the master for free to trade!
Disclaimer: This article is reproduced from the Internet. If there is any infringement, please contact us to delete it immediately. In addition: This article only represents the personal opinion of the author and has nothing to do with Mato Finance The originality and the text and content stated in this article have not been confirmed by this site. The authenticity, completeness and timeliness of this article and all or part of the content and text are not guaranteed or promised. Please refer to it for reference only Verify the content yourself.
Copyright belongs to the author.
For commercial reprints, please contact the author for authorization. For non-commercial reprints, please indicate the source.
MyFxtops迈投(www.myfxtops.com)-靠谱的外汇跟单社区,免费跟随高手做交易!
免责声明:本文系转载自网络,如有侵犯,请联系我们立即删除,另:本文仅代表作者个人观点,与迈投财经无关。其原创性以及文中陈述文字和内容未经本站证实,对本文以及其中全部或者部分内容、文字的真实性、完整性、及时性本站不作任何保证或承诺,请读者仅作参考,并请自行核实相关内容。
著作权归作者所有。
商业转载请联系作者获得授权,非商业转载请注明出处。


