
Bottom line: Gold seems to have carved a meaningful top around $1986 levels yesterday. A break below $1960 would confirm the same and bears might be back in control, going forward. The yellow metal should ideally stay below $1986 mark.
Fundamental Outlook:
DAX has managed to recover up to +2.71% yesterday, closing around 12646 mark. The indice had come under selling pressure last week, as Q2 GDP figures for Euro Zone contracted further. The recent selloff in DAX and FTSE might be the beginning of a much deeper correction. With rising tensions between the US and China, Dow Jones, SPX500 and NASDAQ might be vulnerable for a collapse.
Gold has managed to hit yet another high at $1986 levels yesterday. The metal could be vulnerable for a reversal as the US Dollar is gaining momentum across the board. If the US Dollar Index (DXY) is able to push further above 95.50/96.00, Gold might face further selling pressure.
US Indices would be taking cues from the ongoing negotiations for extending the Unemployment benefits, which expired on July 31, 2020. Failure to reach an agreement might be seen as a negative and lead to a potential selloff in risk assets, going forward.
Technical Analysis:
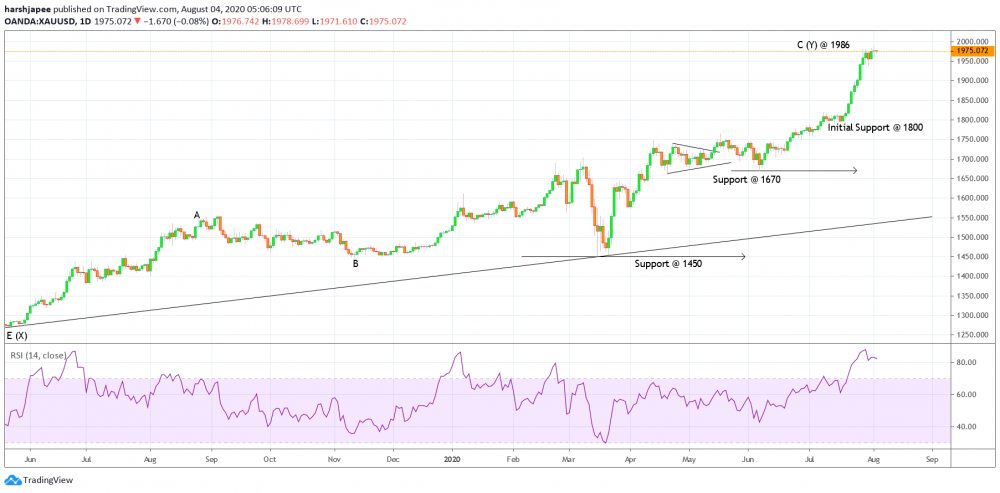
Gold has managed to print $1986 yesterday before pulling back lower. The yellow metal had dropped through $1960 before finding support. It is seen to be trading around $1975 as we prepare to publish, and we need to see a break below $1960 to confirm a potential top in place.
Gold rally towards $1986 yesterday was accompanied by a bearish divergence on the daily RSI. This could be an indication of a potential bearish reversal ahead. Furthermore, the metal has produced a Star Doji candlestick pattern on the Daily Chart, indicating a potential trend reversal.
A confirmed Evening Star candlestick pattern would be formed if prices manage to close around $1956 today. Traders might be willing to initiate fresh short positions thereafter. Alternately, a push through $1986 may see prices soar above $2000 mark.
Prepared by
Harsh Japee, Technical Analyst.
Gold Chart
MyFxtops 邁投 (www.myfxtops.com) -Reliable Forex Copy Trade community, follow the master for free to trade!
Disclaimer: This article is reproduced from the Internet. If there is any infringement, please contact us to delete it immediately. In addition: This article only represents the personal opinion of the author and has nothing to do with Mato Finance The originality and the text and content stated in this article have not been confirmed by this site. The authenticity, completeness and timeliness of this article and all or part of the content and text are not guaranteed or promised. Please refer to it for reference only Verify the content yourself.
Copyright belongs to the author.
For commercial reprints, please contact the author for authorization. For non-commercial reprints, please indicate the source.
MyFxtops迈投(www.myfxtops.com)-靠谱的外汇跟单社区,免费跟随高手做交易!
免责声明:本文系转载自网络,如有侵犯,请联系我们立即删除,另:本文仅代表作者个人观点,与迈投财经无关。其原创性以及文中陈述文字和内容未经本站证实,对本文以及其中全部或者部分内容、文字的真实性、完整性、及时性本站不作任何保证或承诺,请读者仅作参考,并请自行核实相关内容。
著作权归作者所有。
商业转载请联系作者获得授权,非商业转载请注明出处。


