
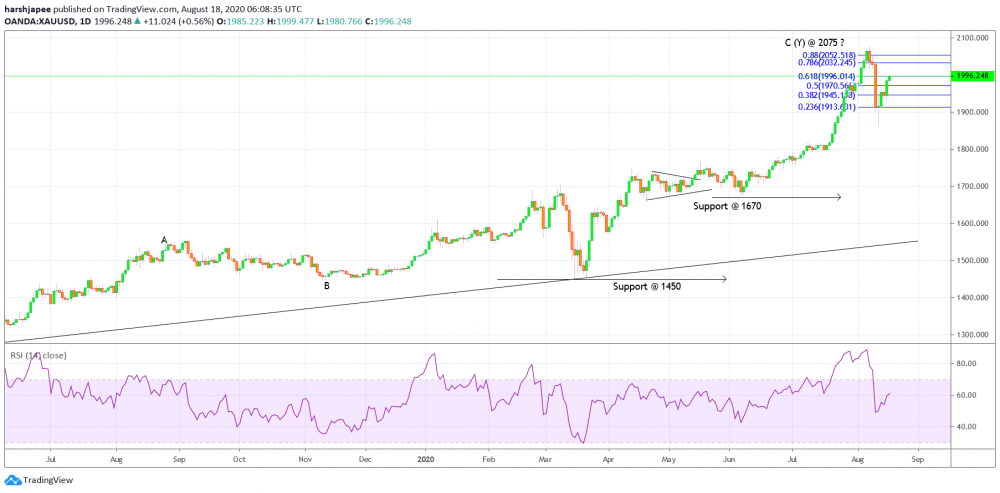
Bottom line: Gold might have just carved a potential top around $2075 over the last week. It cannot be confirmed yet, but a drop below $1862 would ascertain that the yellow metal is back in control of bears. Alternately, a break above $2075 would print yet another high around $2100 before finding resistance.
Fundamental Outlook:
DAX has remained almost flat, closing marginally lower around 12887 mark yesterday. SPX500 was an exception closing higher by +0.50% around 3384 levels. DAX, along with global indices might be taking its cues from the FOMC, ECB over the week. Also rising US-China tensions remain a major cause of concern for risk sentiment, going forward.
WTI Crude process are trading steady around $42.50/60 levels for now, as it awaits the OPEC meet scheduled for tomorrow. It remains to be seen if production cuts are further tapered from 7.7 million barrels per day, amidst rising COVID-19 infections across Europe again.
Gold prices eased off to $1862 last week but is gaining traction again as the metal trades above $2000 mark today. On the news front, Warren Buffets’ Berkshire Hathaway has surprisingly bought a gold mining company, Barrick Gold. Gold need to break below$1862 to confirm further downside.
Technical Analysis:
Gold might have carved a potential top around $2075 but needs to break below $1862 to confirm. The yellow metal has raised above the $2000 mark today and it remains to be seen whether or not it is able to sustain below $2075 mark. Being watchful at the moment.
Gold has produced a religious rally since $1262 lows in May 2019. The metal has breached $1920 highs and managed to print $2075 before reversing sharply. The weekly chart has produced an engulfing bearish candlestick pattern and if it holds well, the metal should fid resistance around $1996/2006 levels today.
Most aggressive traders might be preparing to initiate fresh short positions around current price action ($2000) as it is also the fibonacci 0.618 retracement zone of the entire drop. Protective stops remain above $2075, while projected targets might point below $1500.
Prepared by
Harsh Japee, Technical Analyst.
Gold Chart
MyFxtops 邁投 (www.myfxtops.com) -Reliable Forex Copy Trade community, follow the master for free to trade!
Disclaimer: This article is reproduced from the Internet. If there is any infringement, please contact us to delete it immediately. In addition: This article only represents the personal opinion of the author and has nothing to do with Mato Finance The originality and the text and content stated in this article have not been confirmed by this site. The authenticity, completeness and timeliness of this article and all or part of the content and text are not guaranteed or promised. Please refer to it for reference only Verify the content yourself.
Copyright belongs to the author.
For commercial reprints, please contact the author for authorization. For non-commercial reprints, please indicate the source.
MyFxtops迈投(www.myfxtops.com)-靠谱的外汇跟单社区,免费跟随高手做交易!
免责声明:本文系转载自网络,如有侵犯,请联系我们立即删除,另:本文仅代表作者个人观点,与迈投财经无关。其原创性以及文中陈述文字和内容未经本站证实,对本文以及其中全部或者部分内容、文字的真实性、完整性、及时性本站不作任何保证或承诺,请读者仅作参考,并请自行核实相关内容。
著作权归作者所有。
商业转载请联系作者获得授权,非商业转载请注明出处。


