
Bottom line: AUDUSD long term structure continues to remain bullish against 0.5505 lows in March 2020. In the near term though, the currency might be facing stiff resistance around 0.7275/0.7300 levels as bears prepare to be back in control.
Fundamental Outlook:
Dow Jones has been drifting in a range and managed to close marginally lower around 27797 levels yesterday. SPX500 has managed to tick higher again and closed around 3393; futures hitting all-time high around 3398 today. Markets will be looking forward for FOMC minutes today around 02:00 PM EST.
Global equity markets, especially SPX500 and NASDAQ, Gold, EURUSD, US Dollar Index, AUDUSD, NZDUSD, GBPUSD and others continue to trade near their respective price extremes. Geopolitical risk remains as US-China tensions keep rising and if phase one deal is cancelled, we might witness a severe risk aversion. The US Dollar and Japanese Yen stand to be the only beneficiaries in that case.
AUDUSD exchange rate inched marginally higher yesterday and hit 0.7265 mark. The risk associated currency pair might be face selling pressure towards 0.7275/0.7300 levels, as it has already entered overbought zones. Further if risk assets sell off, it might act as a fuel for the exchange rate to slide.
Technical Analysis:
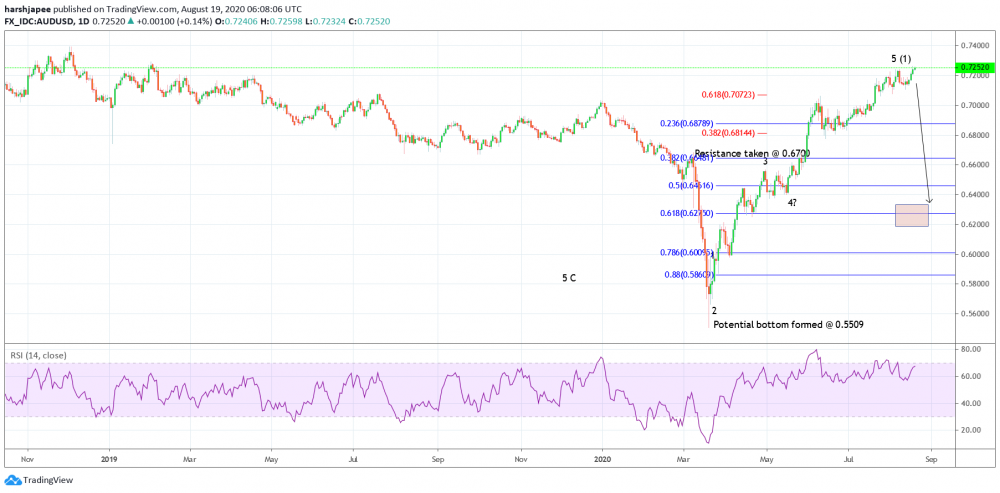
AUDUSD might be preparing to reverse lower as it prints fresh high around 0.7265 mark accompanied by bearish divergence on the daily RSI. Bulls might be targeting to take out past resistance around 0.7290 mark, before giving in to bears going forward.
AUDUSD had dropped to fresh swing lows around 0.5505 levels in March 2020. Since then, it has been in control of bulls and managed to carve a series of higher highs and higher lows through 0.7265 levels early this week. The entire rally might have completed an impulse wave and hence a corrective wave might be due to push prices towards 0.6300 I the next several weeks.
Also note that fibonacci 0.618 retracement of the above rally is seen through 0.6275 levels. High probability remains for a bullish bounce, if AUDUSD manages to drop through those levels. Most traders might be preparing to take profits on long positions initiated earlier and remain flat.
Prepared by
Harsh Japee, Technical Analyst.
AUDUSD Chart
MyFxtops 邁投 (www.myfxtops.com) -Reliable Forex Copy Trade community, follow the master for free to trade!
Disclaimer: This article is reproduced from the Internet. If there is any infringement, please contact us to delete it immediately. In addition: This article only represents the personal opinion of the author and has nothing to do with Mato Finance The originality and the text and content stated in this article have not been confirmed by this site. The authenticity, completeness and timeliness of this article and all or part of the content and text are not guaranteed or promised. Please refer to it for reference only Verify the content yourself.
Copyright belongs to the author.
For commercial reprints, please contact the author for authorization. For non-commercial reprints, please indicate the source.
MyFxtops迈投(www.myfxtops.com)-靠谱的外汇跟单社区,免费跟随高手做交易!
免责声明:本文系转载自网络,如有侵犯,请联系我们立即删除,另:本文仅代表作者个人观点,与迈投财经无关。其原创性以及文中陈述文字和内容未经本站证实,对本文以及其中全部或者部分内容、文字的真实性、完整性、及时性本站不作任何保证或承诺,请读者仅作参考,并请自行核实相关内容。
著作权归作者所有。
商业转载请联系作者获得授权,非商业转载请注明出处。


