
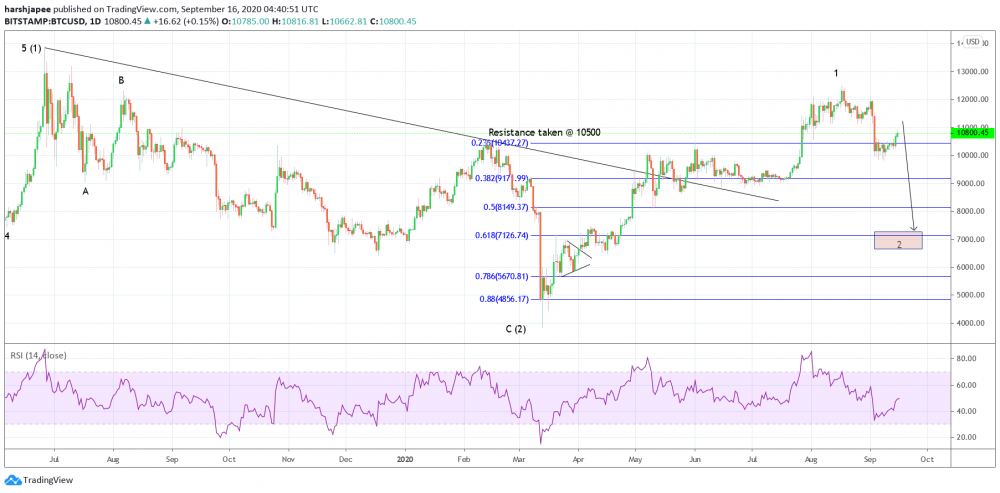
Bottom line: Bitcoin long term structure continues to remain bullish against 3850 lows, print in March 2020. Over the next few weeks, bears might remain in control as they prepare to push towards 7200-8000 levels. Only a push above 12500 would nullify the above bearish view.
Fundamental Outlook:
Dow Jones has found bids from 27100/200 lows since September 09, 2020. The indice trades above 28000 for now and might face renewed selling pressure around 28500 levels. Further with FOMC today around 02:00 PM EST, it would be interesting to see how indices react to Fed’s economic projections. Interest rates are expected to remain unchanged at 0.25%.
AUDUSD has managed to recover from 0.7200 lows from last week. The exchange rate is trading around 0.7320 mark over strong economic data coming out of China, as we prepare to publish. The US Dollar might be taking its cues from FOMC today and it might continue to gain if risk aversion returns. The risk associated AUDUSD might remain under pressure in that case.
Bitcoin trades around 10900 levels for now and might remain under pressure as the safe haven US Dollar is set to gain over the next few weeks. The crypto currency might find buyers if it reaches around the 7000-8000 mark, going further.
Technical Analysis:
Bitcoin has remained in control of bears since printing 12470 highs in the past few trading sessions. The crypto might be carving a meaningful corrective drop towards 7200 levels, before resuming its long term rally. Intraday rallies might remain capped below 12500 levels as bears looking poised to stay in control over the next few weeks.
Bitcoin faces immediate resistance around 12000, followed by 12500; while support comes in around 9000 mark respectively. A break below 9000 levels would add further confidence to the bearish setup and open doors for a push towards 7200 levels going further.
Bitcoin bulls have managed to stay in control since 3850 lows in March 2020. The crypto has managed to carve a series of higher highs and higher lows through 12470 levels. The entire rally between 3850 and 12470 looks like a potential impulse wave, which should be followed by a corrective drop.
The above proposed corrective drop might be underway and could reach towards 7200 levels which is fibonacci 0.618 retracement of the entire rally between 3850 and 12500. High probability remains for a bullish bounce if prices manage to reach there.
Most traders might be inclined to hold short positions taken earlier around 12000 levels, with protective stops above 12500 and projected targets towards 7200 levels respectively. A consistent break above 12500 mark might change the near term bearish outlook.
Prepared by
Harsh Japee, Technical Analyst.
Bitcoin Chart
Disclaimer:
“This market commentary and analysis has been prepared for AT Global Markets UK Ltd (ATFX UK) by a third party for general information purposes only. Any view expressed does not constitute a personal recommendation or solicitation to buy or sell as it does not take into account your personal circumstances or objectives, and should therefore not be interpreted as financial, investment or other advice, or relied upon as such.
You should therefore seek independent advice before making any investment decisions. This information has not been prepared in accordance with legal requirements designed to promote the independence of investment research and as such is considered to be a marketing communication.
Although we are not specifically constrained from dealing ahead of our recommendations we do not seek to take advantage of them before they are provided to our clients. We aim to establish and maintain and operate effective organizational and administrative arrangements with a view to taking all reasonable steps to prevent conflicts of interest from constituting or giving rise to a material risk of damage to the interests of our clients.
The market data is derived from independent sources believed to be reliable, however we make no representation or warranty of its accuracy or completeness, and accept no responsibility for any consequence of its use by recipients. Reproduction of this information, in whole or in part, is not permitted.”
MyFxtops 邁投 (www.myfxtops.com) -Reliable Forex Copy Trade community, follow the master for free to trade!
Disclaimer: This article is reproduced from the Internet. If there is any infringement, please contact us to delete it immediately. In addition: This article only represents the personal opinion of the author and has nothing to do with Mato Finance The originality and the text and content stated in this article have not been confirmed by this site. The authenticity, completeness and timeliness of this article and all or part of the content and text are not guaranteed or promised. Please refer to it for reference only Verify the content yourself.
Copyright belongs to the author.
For commercial reprints, please contact the author for authorization. For non-commercial reprints, please indicate the source.
MyFxtops迈投(www.myfxtops.com)-靠谱的外汇跟单社区,免费跟随高手做交易!
免责声明:本文系转载自网络,如有侵犯,请联系我们立即删除,另:本文仅代表作者个人观点,与迈投财经无关。其原创性以及文中陈述文字和内容未经本站证实,对本文以及其中全部或者部分内容、文字的真实性、完整性、及时性本站不作任何保证或承诺,请读者仅作参考,并请自行核实相关内容。
著作权归作者所有。
商业转载请联系作者获得授权,非商业转载请注明出处。


