
The September selloff in US stocks doesn’t seem to be letting up.
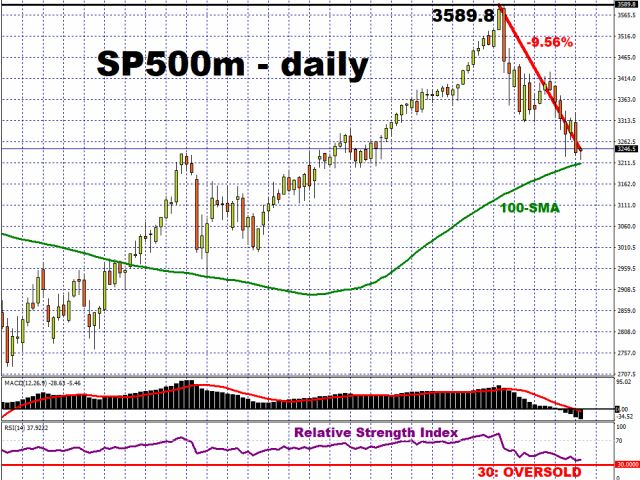
The S&P 500 is now flirting with a technical correction, which is when the price of an asset falls 10 percent or more from its recent high. The US benchmark equity index is now about 0.4 percentage points away from meeting that criteria, headed for its 100-day simple moving average (MA), with its futures flat during the Asian morning session.
Wednesday’s US session also saw the Nasdaq 100 (NDX) posting its first daily loss so far this week, leaning further into its correction. The tech-heavy index is now 10.55 percent lower on a month-to-date basis, and has fallen by around 13 percent from its record high. The NDX also appears set on a path towards its 100-day simple moving average, although Nasdaq 100 minis are noticeably undecided about whether to extend losses at the time of writing. Still, its 50-day counterpart now provides immediate resistance.
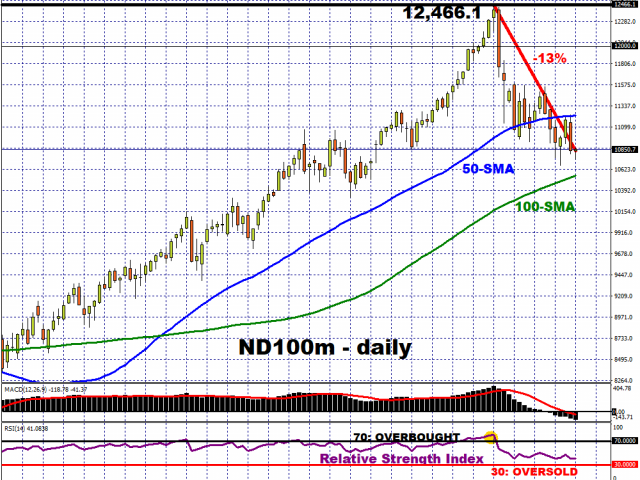
Note that the respective 14-day relative strength indexes for the S&P 500 and the Nasdaq 100 have yet to hit the 30 threshold, a level which denotes oversold conditions. That suggests that US stocks could yet see more declines over the near-term.
Investors are coming to terms with the idea that the next round of US fiscal stimulus won’t arrive before the US elections, despite the repeated stresses by Fed officials that more government financial support is needed in order to sustain the still-nascent economic recovery. The spectre of drawn-out political uncertainty even after the November 3rd elections is also casting a huge dark cloud over market sentiment.
Yet judging by some indicators, some market participants don’t seem too particularly alarmed. The VIX index, which is widely seen as Wall Street’s fear gauge, has actually moderated since making a run towards the 40 level earlier this month. The VIX now reads below 30, and is testing its 200-day simple moving average, which is also serving as its immediate resistance line. The CBOE’s put options to call options ratio is still around half compared to levels seen during the market crash in March.
Equity bulls and bear are expected to continue duking it out in dictating how much longer the current selloff will persist. Although the longer-term investor will be heartened by the Fed’s lower-for-longer rates mantra, which should be supportive for stocks for years to come, perhaps they’ll just have to weather these near-term bumps along the way. At the time of writing, the FXTM trader sentiment remains net long on both the SP500m as well as the ND100m.
MyFxtops 邁投 (www.myfxtops.com) -Reliable Forex Copy Trade community, follow the master for free to trade!
Disclaimer: This article is reproduced from the Internet. If there is any infringement, please contact us to delete it immediately. In addition: This article only represents the personal opinion of the author and has nothing to do with Mato Finance The originality and the text and content stated in this article have not been confirmed by this site. The authenticity, completeness and timeliness of this article and all or part of the content and text are not guaranteed or promised. Please refer to it for reference only Verify the content yourself.
Copyright belongs to the author.
For commercial reprints, please contact the author for authorization. For non-commercial reprints, please indicate the source.


